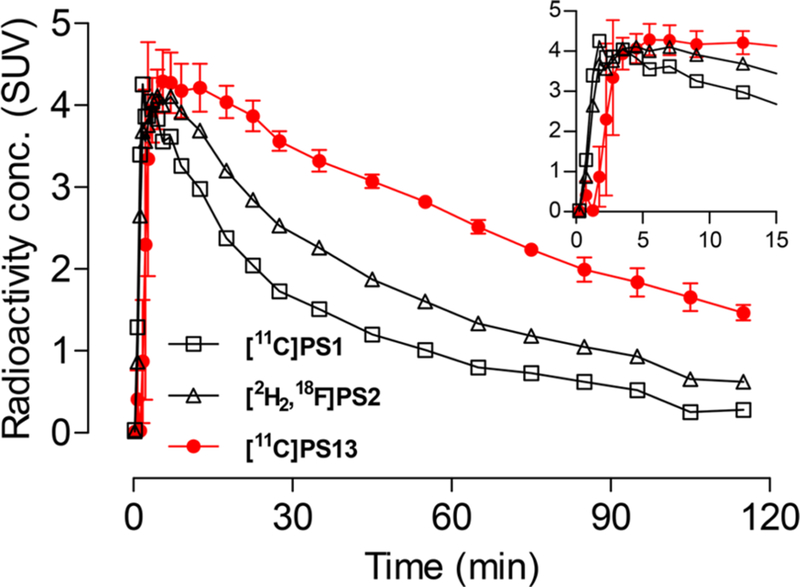
Figure 1.

PET time–activity curves from rhesus monkey whole brain (gray matter) following intravenous injection of [11C]PS1 (n = 1), [2H2,18F]PS2 (n = 1), and [11C]PS13 (mean ± SD, n = 3). The inset expands the data presentation over the early stage of scanning.
