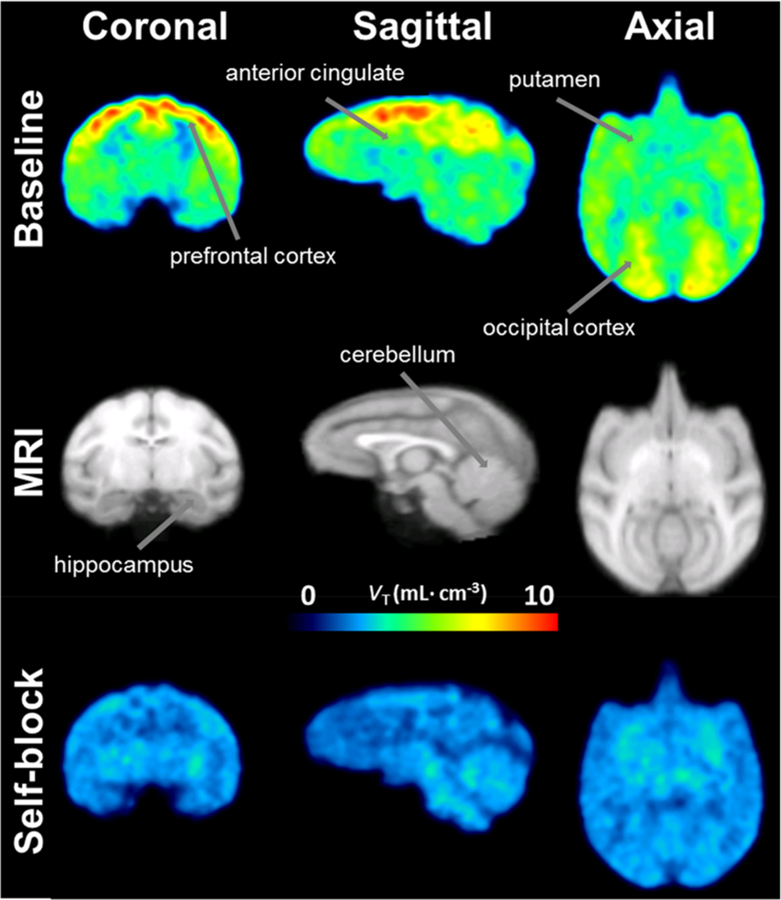
Figure 6.

Parametric images of VT for [11C]PS13 in brain of a normal rhesus monkey at baseline (top row) and after blocking with PS13 (1 mg/kg, i.v.; bottom row). Kinetic analysis was performed at the voxel level using a Logan plot, so that the resulting VT values are shown as PET images. The middle row shows template MRI scans.
