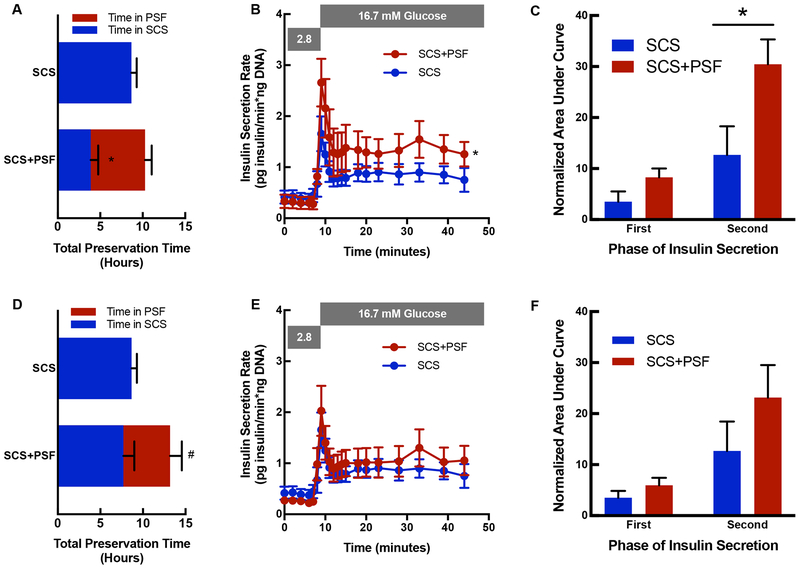
Figure 3: Function of SCS+PSF and SCS islets.
A. Total organ preservation time (hours) is presented for islets isolated from a cohort matched for total preservation time. Experimental groups are presented on y axis (n=8 for SCS+PSF and n=6 for SCS). Bar area in blue denotes time in SCS, and red area denotes time in PSF. *P<0.05 denotes difference between time in SCS (blue). B. GSIS was determined in islets isolated from SCS (blue) and SCS+PSF (red) pancreata that were matched for total preservation time. The insulin secretion rate (Y axis) by time (minutes, x axis) is presented. SCS+PSF islets have higher insulin secretion than SCS islets (*, P<0.05). C. First and Second Phase AUC are presented for islets isolated from a cohort matched for duration of total preservation time. AUC is presented on the y axis and insulin secretion phase is presented on the x axis for SCS islets (blue, n=6) and SCS+PSF islets (red, n=8). *P<0.05 denotes difference between SCS and SCS+PSF second phase insulin secretion. D. Total organ preservation time (hours) is presented for islets isolated from a cohort matched for duration of SCS (blue portion). Experimental groups are presented on y axis (n=5 for SCS+PSF and n=6 for SCS) and the red portion of the bar in SCS+PSF indicates PSF. #P<0.05 denotes difference between total preservation time. E. GSIS is presented for SCS and SCS+PSF islets for the SCS matched cohort and no difference in responsiveness were identified. F. First and Second Phase AUC are presented for islets isolated from a cohort matched for duration of SCS. AUC is presented on the y axis and insulin secretion phase is presented on the x axis for SCS islets (blue, n=6) and SCS+PSF islets (red, n=5).

