
Fig. 5.
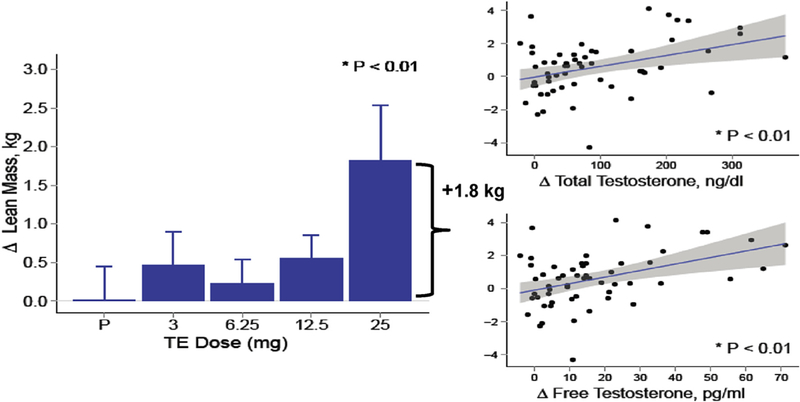
Lean Body Mass in a dose-response study in postmenopausal women with androgen deficiency. In the bar graphs on the left, data represent absolute mean (SE) changes from baseline for each treatment group. Scatter plots on the right display estimates and 95% CI for the generalized additive model of change in outcomes as function of free testosterone levels (Adapted from Huang et al., 2014).