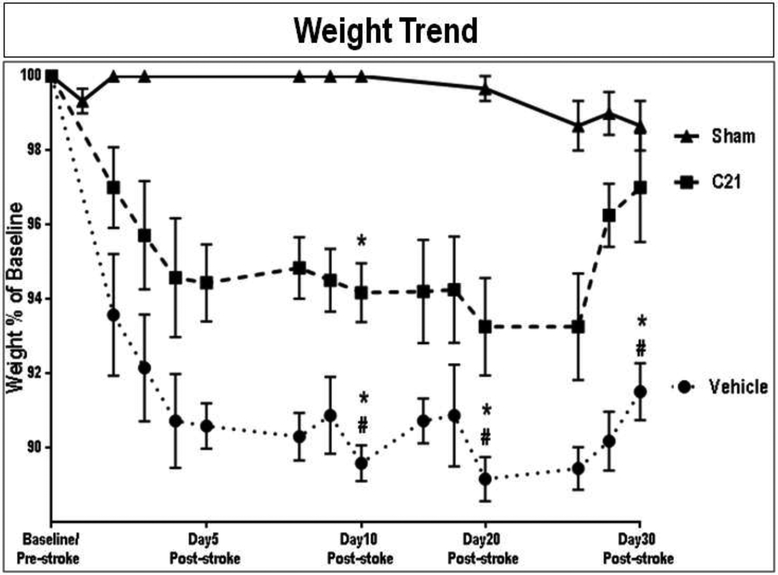
Fig. 2: Effect of AT2R stimulation on the body weight of aged wistar animals post-stroke.
The weight trend is represented as % of baseline (pre-surgical weight). A compound symmetric variance co-variance structure provided the best model fit. Differences between groups for specific days (0, 1, 8, 10, and 30) were examined using the estimated least squares means from a repeated measures mixed model and using a Bonferroni adjustment to the overall alpha level for the number of comparisons made between groups (Group x Day x Day effect: F=3.92, P=0.0895. (n = 6-7 animals/group). Symbols and error bars indicate mean and SEM,
*indicate significantly different from sham
# indicate significantly different from treatment

