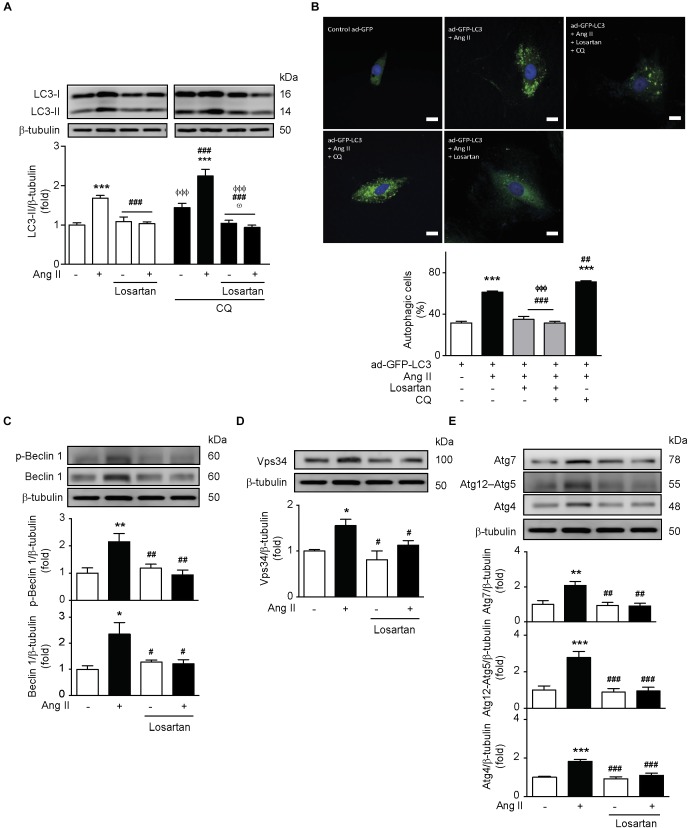
FIGURE 3.
Ang II induces autophagy through an AT1R-dependent mechanism. (A) A7r5 cells were pre-treated with Losartan 1 μM 1 h before stimulation with Ang II 100 nM for 24 h. During the last 4 h of stimulus, cells were also treated in the presence and absence of CQ 30 μM. LC3-II levels were determined by Western blot and normalized by β-tubulin (n = 5). (B) A7r5 cells were transduced with an adenovirus overexpressing LC3-GFP (ad-LC3-GFP), using an MOI of 180. After 24 h of incubation, cells were pretreated with losartan 1 μM, 1 h before stimulation with Ang II 100 nM for 24 h. During the last 4 h of stimulus with Ang II, cells were incubated in the presence or absence of CQ 30 μM. The nucleus were stained with Hoechst. Cells were visualized by confocal microscopy. The images are representative of n = 3, 30 cells per n. Scale bar = 25 μm. (C) A7r5 cells were pre-treated with losartan 1 μM, 1 h before stimulation with Ang II 100 nM for 24 h. Levels of Beclin 1 and its phosphorylation in Thr119 (p-Beclin 1) were determined by Western blot and normalized by β-tubulin (n = 4). (D) A7r5 cells were pretreated with losartan 1 μM, 1 h before stimulation with Ang II 100 nM for 24 h. Vps34 levels were determined by Western blot and normalized by β-tubulin (n = 3). (E) A7r5 cells were pretreated with losartan 1 μM, 1 h before stimulation with Ang II 100 nM for 24 h. Levels of Atg7, Atg12–Atg5, and Atg4 were determined by Western blot and normalized by β-tubulin (n = 4–5). The results are shown as mean ± SEM. Data were analyzed using one way ANOVA followed by Newman–Keuls post hoc test. ∗p < 0.05, ∗∗p < 0.01, ∗∗∗p < 0.001 vs. control; #p < 0.05, ##p < 0.01, ###p < 0.001 vs. Ang II; ΦΦΦp < 0.001 vs. Ang II + CQ; ωp < 0.05 vs. CQ.

