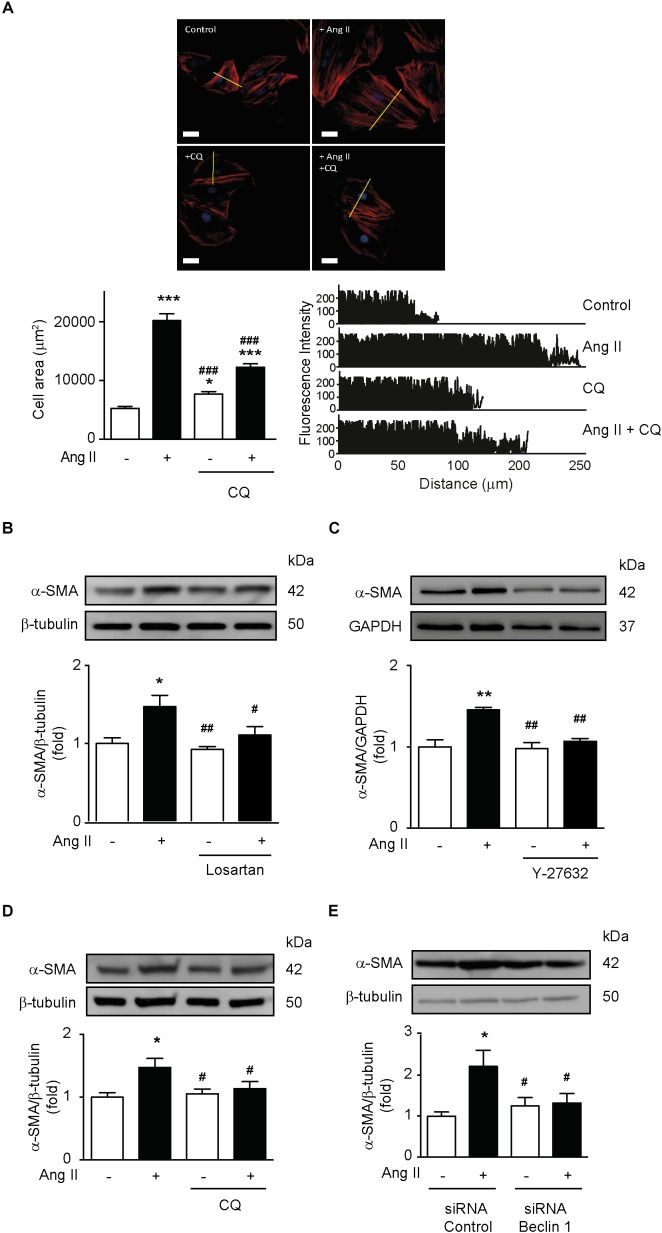
FIGURE 5.
Ang II-dependent autophagy elicits hypertrophy in VSMCs. (A) A7r5 cells were treated with or without Ang II 100 nM. During the last 4 h of stimulus, cells were treated in the presence and absence of CQ 30 μM. Then cells were stained with phalloidin–rhodamine and nuclei were stained with Hoechst. Images were captured using a confocal microscope using 40x lens. Cell area and fluorescence intensity were measured using the ImageJ software. n = 3,30 cells per condition. Scale bar = 25 μm. A7r5 cells were pre-treated with (B) Losartan 1 μM or (C) Y-27632 10 μM, 1 h before stimulation with Ang II 100 nM for 24 h. During the last 4 h of stimulus, cells were treated in the presence and absence of CQ 30 μM (D). (E) A7r5 cells were transfected with a control siRNA or siRNA against Beclin 1 100 nM for 6 h and incubated in DMEM with 2% of FBS for 16 h. Cells were then stimulated with Ang II 100 nM for 24 h. α-SMA levels were evaluated by Western blot and normalized by β-tubulin (n = 5). α-SMA levels were determined by Western blot and normalized by GAPDH (n = 5). Data were analyzed using Student’s t-test or one way ANOVA followed by Newman–Keuls post hoc test. The results are shown as mean ± SEM. ∗p < 0.05, ∗∗p < 0.01, ∗∗∗p < 0.001 vs. control; #p < 0.05, ##p < 0.01, ###p < 0.001 vs. Ang II.

