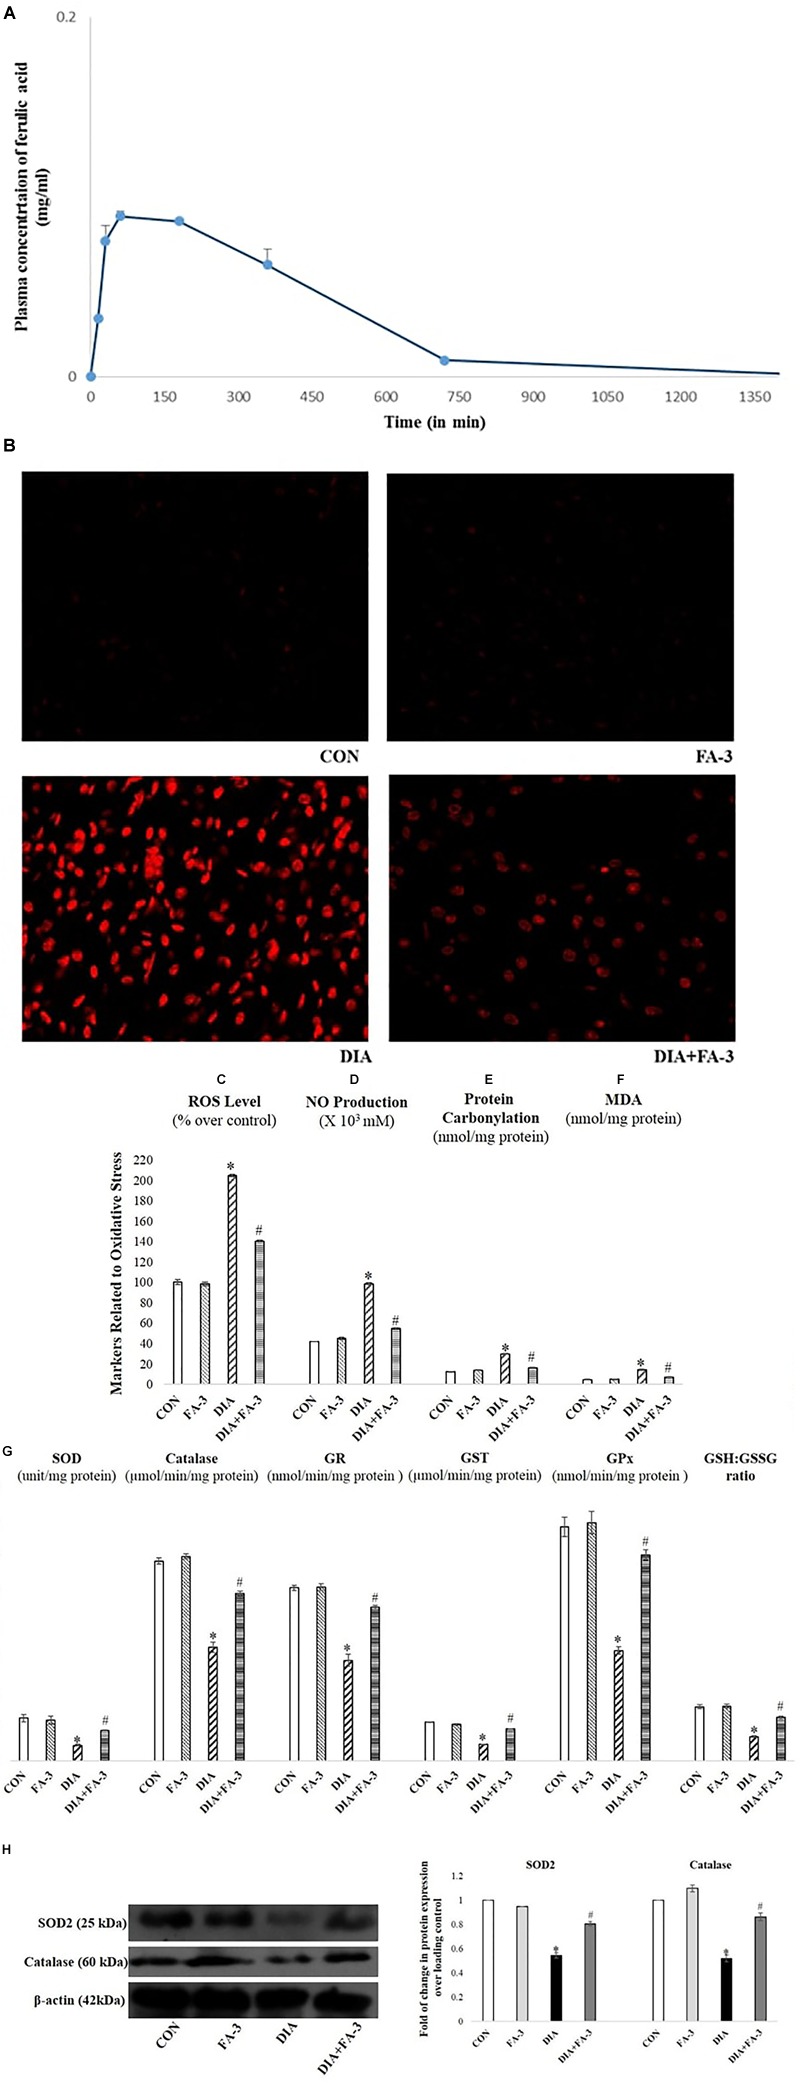
FIGURE 5.

(A) Mean plasma concentration-time profiles succeeding oral administration of ferulic acid (50 mg kg-1 body wt.); each point represents the mean ± SD. Role of ferulic acid on parameters related to oxidative insult. (B) Detection of ROS by DHE staining (×400); (C) ROS level; (D) NO production; (E) protein carbonylation; (F) lipid peroxidation (MDA); (G) activities of antioxidant enzymes and assessment of redox ratio (GSH/GSSG); (H) assessment of SOD2 and catalase expression through western blot analysis and respective densitometry analysis of the same in the kidney tissue of the experimental rats. CON: untreated rats; FA-3: rats were subjected to ferulic acid treatment only; STZ: diabetic control; STZ+FA-3: rats administered with ferulic acid, post diabetes. Densitometry analysis are denoted as the mean ± SEM of three independent experiments, ∗P < 0.05 vs. CON; #P < 0.05 vs. DIA; no significant difference existed between CON and FA-3 groups.
