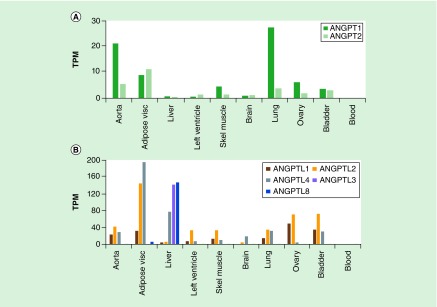
Figure 1. . Expression of ANGPT and ANGPTL genes in different tissues.
RNA-seq data are from GTEx [32] for ten of the available tissue types and are given as median TPM for ANGPT1 and ANGPT2 (A) and five of the ANGPTL genes (B). Note difference scales of the y-axis in (A) and (B). For quantitative data from more tissue types and related genes, see Supplementary Table 1.
Adipose-visc: Adipose from visceral tissue; Skel muscle: Skeletal muscle; TPM: Transcripts per million.

