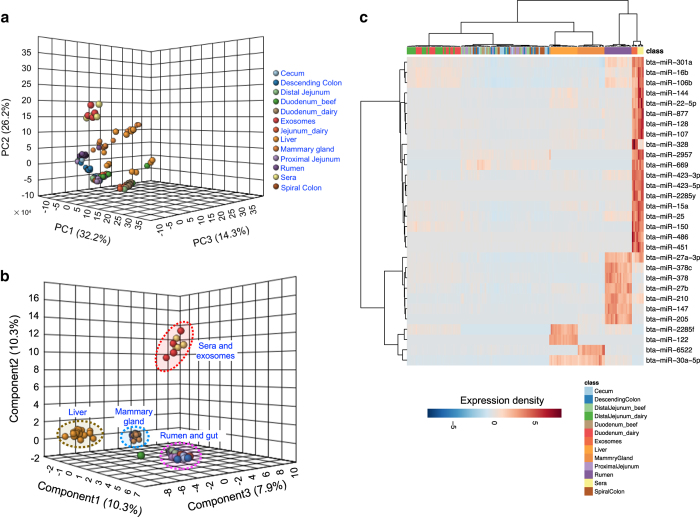
Figure 4. The discriminating profiles of microRNAs (miRNAs) expression in different tissues.
a–c represent the 3-D PCA plot, 3-D sPLS-DA plot, and the heatmap of the miRNAs expression in the bovine sera, exosomes and 11 different tissues. Each tissue was displayed using different colors. PCA = principal component analysis; sPLS-DA = sparse partial least squares-discriminant analysis. The 11 tissues include dairy cow rumen, duodenum, jejunum, liver and mammary gland, beef cattle duodenum, distal jejunum, proximal jejunum, cecum, spiral colon and descending colon.

