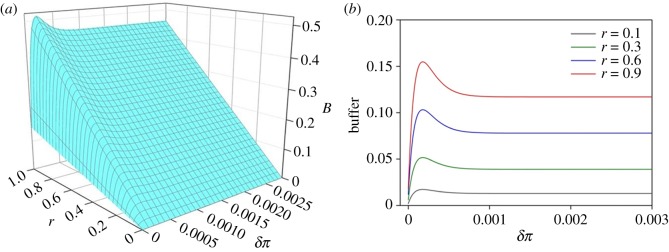
Figure 2.
(a) The relationship between buffer size (B), coefficient (r) and the degree of reduction in genetic diversity (δπ). (b) The buffer size under given parameters of four different coefficients r, i.e. the increase rate of the adaptive potential with the increase of expression diversity. (Online version in colour.)

