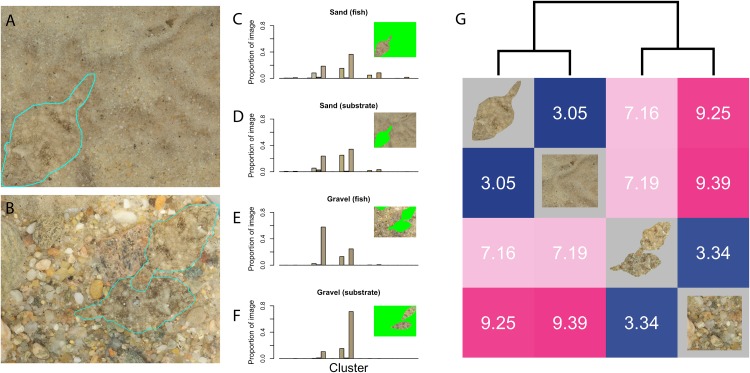
Figure 5. Background-matching analysis.
(A) and (B) Flounder photographed on sand (A) and gravel (B), with fish outlined in cyan; (C–F) color histograms across a restricted color range in CIE Lab space, generated by getLabList, with insets indicating which part of the image was masked out in green and bars colored according to the average color of the pixels in each bin; (G) heatmap representation of distance matrix generated using getColorDistanceMatrix. Photo credit: H. Weller.

