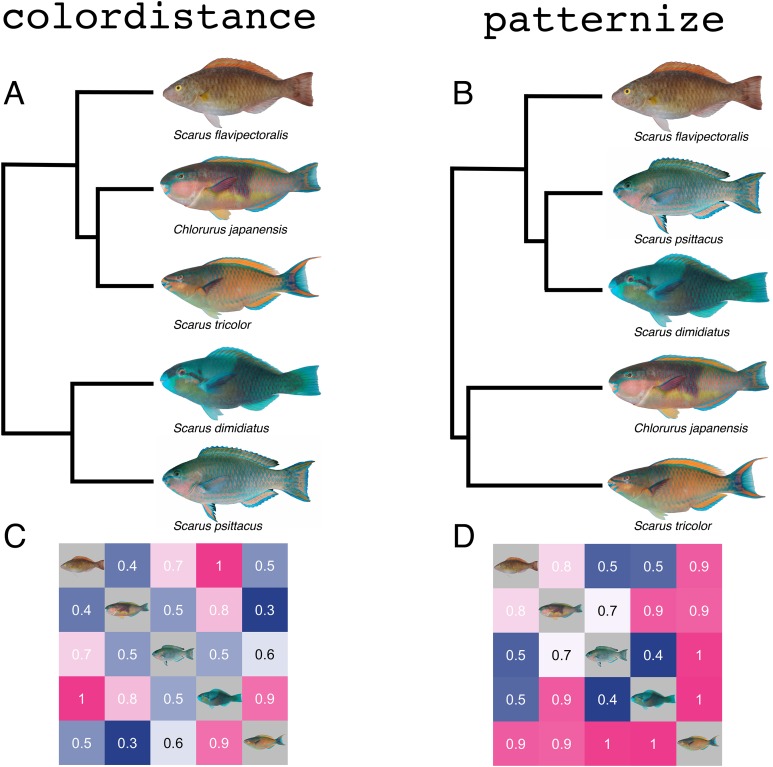
Figure 6. Similarity analyses produced by colordistance (A & C) and patternize (B & D) for the same set of parrotfish images.
(A) and (B) Cluster analyses for color distance matrices produced by colordistance (A) and patternize (B). Branch lengths are proportional to the distances in the heatmaps below each dendrogram. Note the change in position of Scarus flavipectoralis. (C) and (D) Heatmap representations of normalized distance matrices produced by colordistance (C) and patternize (D), with species displayed in the same order for comparison between the heatmaps. Photo credit: M. Westneat/J. T. Williams.

