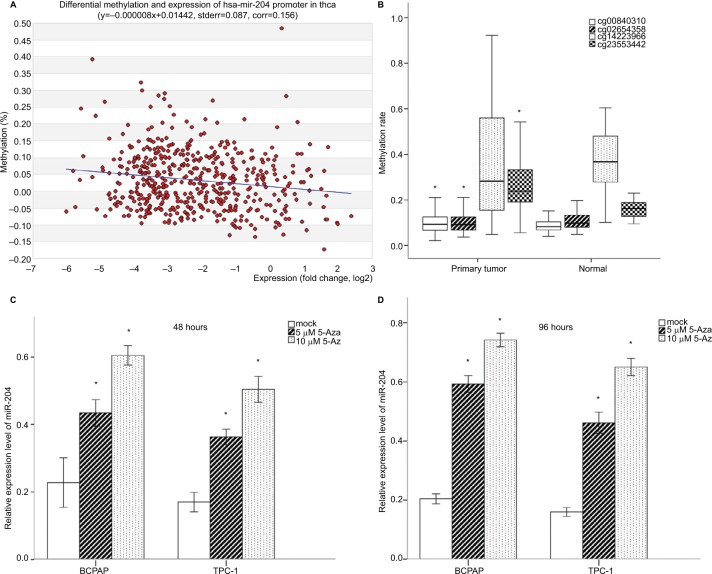
Figure 4.
Promoter DNA methylation analysis of miR-204 with TCGA data.
Notes: (A) Correlation analysis between miR-204 expression levels and promoter methylation levels. The expression levels of miR-204 in tumor tissues were inversely correlated with the promoter DNA methylation rates. (B) Methylation levels of CpG sites from TCGA data. Three of the four CpG sites were hypermethylated in tumor tissues compared to normal tissues. One CpG site was hypomethylated (cg14223966). (C and D) qRT-PCR demonstrated increased expression of miR-204 in PTC cells after treatment with 5-Aza-dye for 48 and 98 hours compared to mock-treated cells. *P<0.05.
Abbreviations: 5-Aza, 5-aza-2′-deoxycytidine; PTC, papillary thyroid carcinoma; qRT-PCR, quantitative real-time PCR.

