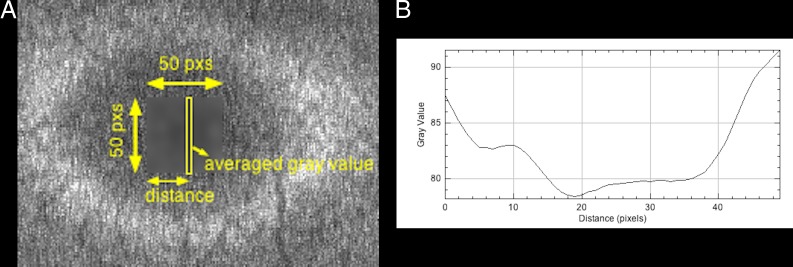
Figure 1.
(A) Enlarged image of the original image. A 50 × 50-px rectangle including the fovea is selected, and the area is blurred to remove noise. Thereafter, the averaged gray value is calculated for every distance from the left side of the 50 × 50-px rectangle. (B) Column average plot of the blurred area in (A). The x-axis represents the horizontal distance from the left side of the 50 × 50-px rectangle, and the y-axis represents the vertically averaged gray value (pixel intensity). In this case, the x-axis value corresponding to the lowest gray value is 19.

