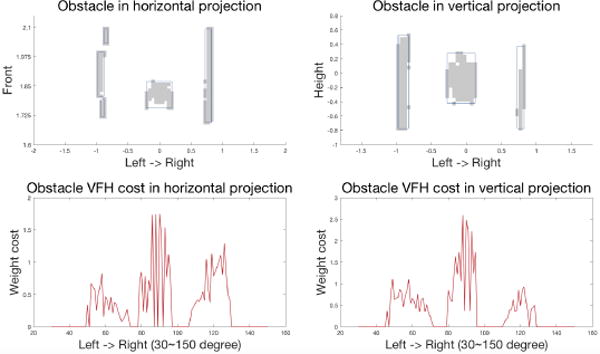
Fig. 15.

Left-top: obstacle detection horizontal projection. The horizontal axis represents the left to right direction in degree, and the vertical axis represents the forward direction in the meter; Left-bottom: obstacle histogram VFH. The horizontal axis is the angular direction in the degrees, and the vertical axis represents the weighted cost of obstacle points about their distance to the user on the horizontal plane. Right side shows the detection in the vertical projection and its VFH.
