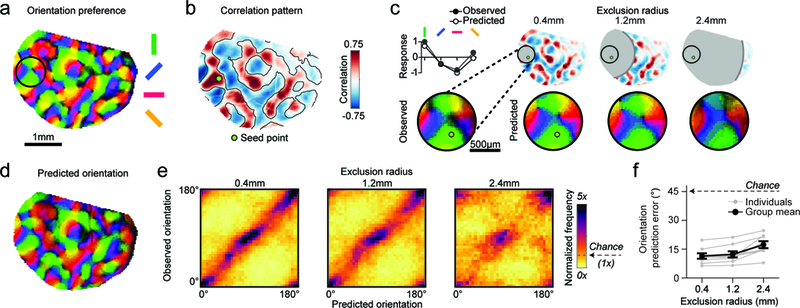
Figure 2: Tuning properties can be predicted from correlated network elements several millimeters away.

a. Orientation preference map. b. Spontaneous correlation pattern (Pearson’s correlation) for indicated seed point. Contour lines from vertical selective domains from (a) reveal that spontaneous correlations closely resemble the layout of orientation preference map. c. Local orientation tuning for region within black circle in (a) can be accurately predicted from the aggregate orientation tuning of distant cortical locations, weighted by long-range correlations. (Top left) Observed and predicted tuning for single pixel shown below. (Bottom left) Observed orientation tuning. (Right) Accurate orientation predictions based on increasingly distant regions of spontaneous correlations (excluding pixels within either 0.4, 1.2, or 2.4 mm from the seed point). d. The prediction based on correlations >1.2 mm away (excluding all correlations <1.2 mm from seed point) matches the actual preferred orientation within the entire field of view (see (a)). e. Across animals, the precision of predicted orientation tuning remains high, even when based on restricted regions more than 2.4mm away from the site of prediction (see (c)) f. Prediction error as function of exclusion radius (45º is chance level). For e, f: n = 8 animal experiments with 5 days or more of visual experience (gray); group data in f is shown as mean ± SEM (black).
