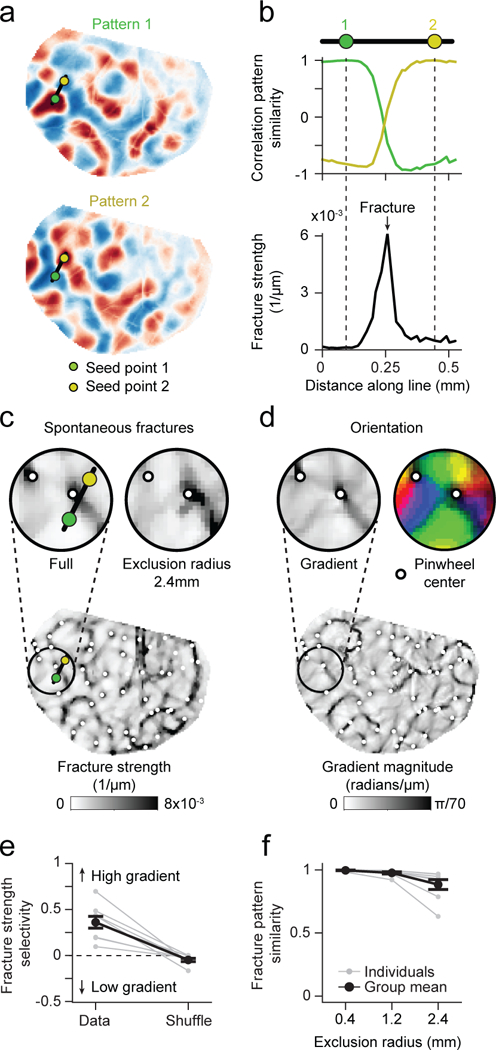
Figure 3: Tight relation between global spontaneous correlation and fine-scale structure of orientation columns after eye-opening (EO).

a-b. Fractures in correlated networks. Advancing the seed-point along the black line in (a) reveals a punctuated rapid transition in global correlation structure expressed by a high rate of change in the correlation pattern between adjacent pixels (b, bottom). c. Locations with high rate of change form a set of lines across the cortical surface, which we termed spontaneous fractures. d. The layout of spontaneous fractures precisely coincides with the high-rate of change regions in the orientation preference map. e. Correlation fractures show selectivity for regions of high orientation gradient. f. Fracture location is independent of local correlation structure and remains stable when only long-range correlations are included (see Fig. 2c). For e, f: n = 8 animal experiments with 5 days or more of visual experience (gray); group data in e, f is shown as mean ± SEM (black).
