
Figure 7: Circuit mechanisms for long-range correlations in early visual cortex.
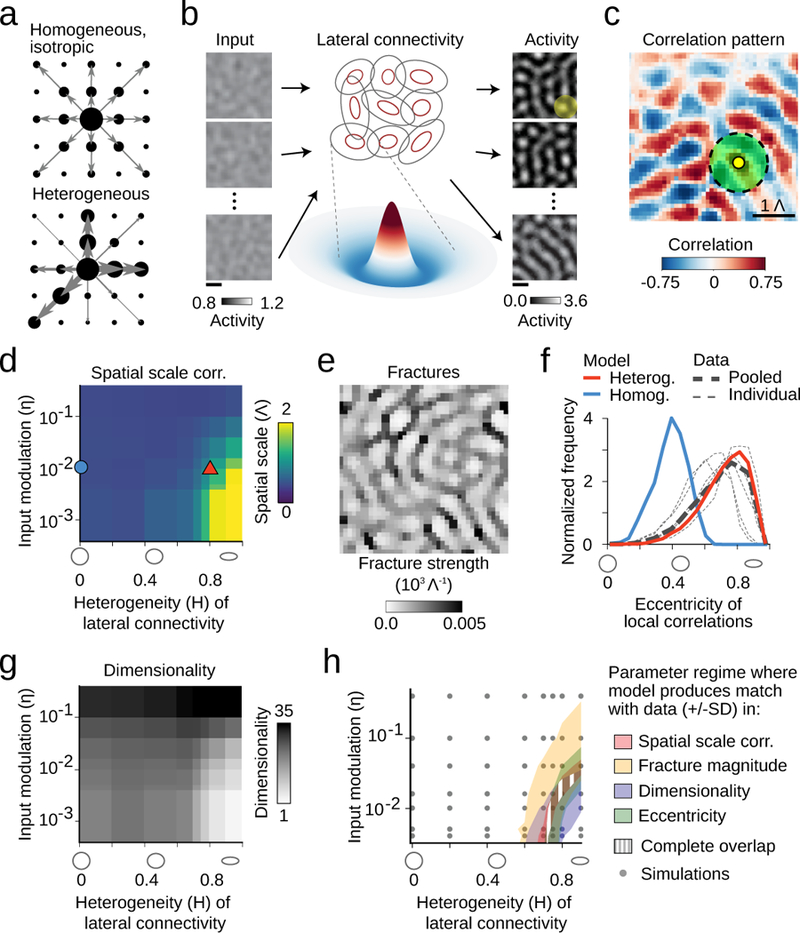
a. Homogenous local connections (arrow) induce moderate correlations (black dots) with all nearby domains (black dots), whereas heterogeneity introduces biases, strengthening some correlations (large dots) more than others (small dots). b. A dynamical circuit model of spontaneous activity in the early cortex: a constant input modulated spatially by filtered noise is fed into a recurrent network with short-range, heterogeneous Mexican-hat (MH) connectivity. It produces a set of modular output patterns with typical spatial scale Λ determined by the MH size (average MH size (2SD of its negative part) illustrated by the green circle). c. In the heterogeneous regime, the model shows long-range correlations in agreement with experiment (heterogeneity H=0.8; input modulation (SD of noise component) η=0.01; n=100 output patterns, 16% of modelled region shown) (top). d. The spatial scale of correlations increases with increasing heterogeneity in the lateral connections and also with decreasing input modulation. Red triangle in (d): parameters used in (c). Blue circle in (d): isotropic, homogeneous connectivity, inconsistent with the range of correlations in experiment (compare d, and Fig. 4d and Supplementary Fig. 8). e. Pronounced fracture pattern in the heterogeneous regime (same parameters as in c). f. Match of empirical data to model predictions of local correlation eccentricity (same parameters as in c). g. Dimensionality of n=100 output patterns produced by the model decreases with increasing heterogeneity and decreasing input modulation. h. In the parameter regime where the model spontaneous patterns approach the empirically observed dimensionality, their short- and long-range correlation structure is in quantitative agreement with the experimental data. Shaded regions show parameter regimes in the model in which different properties lie within the range (mean ± SD) of the experimental values (using 1Λ=1 mm, linear interpolation between simulations). Scale bars: domain spacing 1Λ (b,c,e).