
Figure 6.
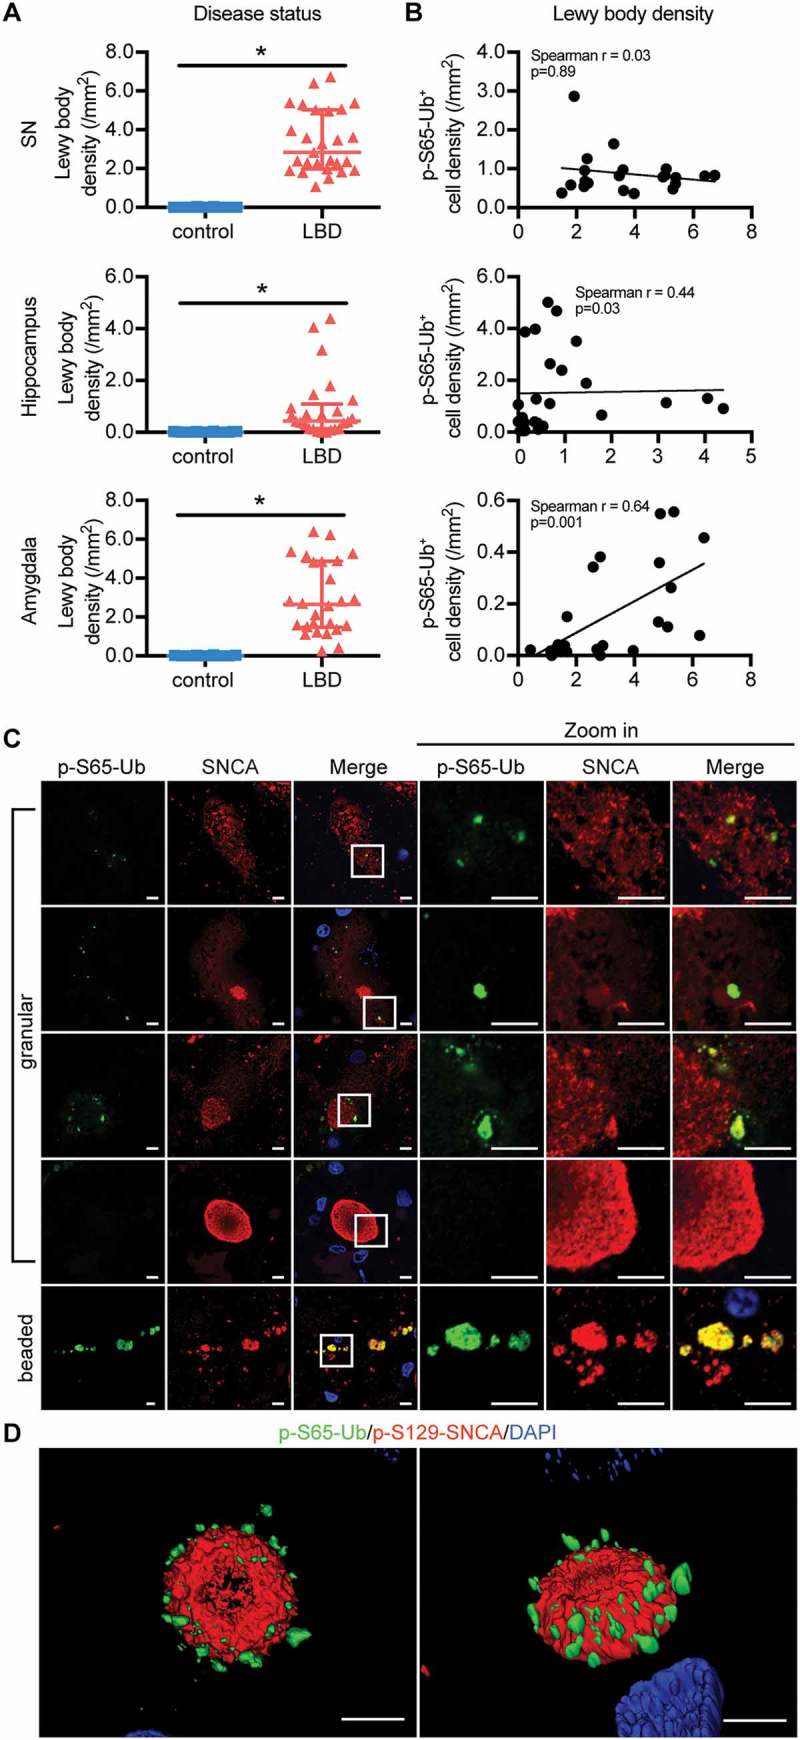
Correlation and interaction of p-S65-Ub and SNCA pathology in LBD brains. (A) Lewy body density in SN, hippocampus and amygdala was compared between age-matched normal controls and LBD cases (Wilcoxon rank sum test, *p < 0.01). Data are presented in scatter-plots showing the median and interquartile range. (B) The correlation between p-S65-Ub and Lewy body density in LBD brains was examined, and significant correlations were observed in the amygdala (Spearman’s test of correlation, significance level: p < 0.01). In controls, n = 20 for SN, n = 20 for hippocampus, n = 16 for amygdala. In LBD, n = 21 for SN, n = 28 for hippocampus, n = 24 for amygdala. Putamen and nbM are shown in Figure S7A, B. (C) SN sections of LBD cases were double immunostained with p-S65-Ub and SNCA antibodies. Cells with different stages of SNCA-positive aggregations are shown. A magnified image of the boxed area is shown to the right. p-S65-Ub (green) colocalizes with SNCA (red) more in beaded neurites than in granules in soma. p-S65-Ub levels appear to decline with maturation of SNCA into LBs. For double labeling with p-S129-SNCA, see Figure S7C. (D) The spatial relationship of p-S65-Ub- and p-S129-SNCA-positive LB is shown in 3D surface rendering. Scale bars: 5 µm.