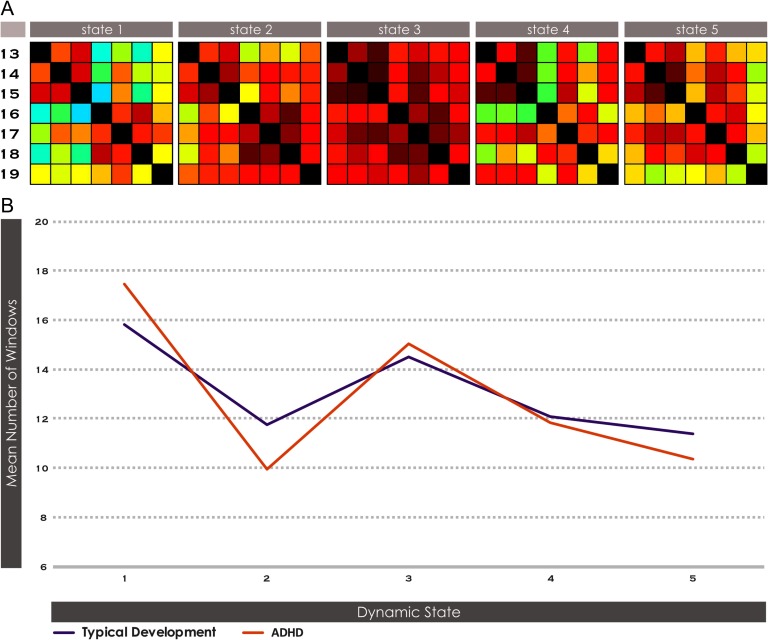
Figure 3. .
Brain states and local dwell time within the DMN system in ADHD vs. TD. Dynamic functional connectivity across five brain states was estimated with k-means clustering of windowed FNC from the ICA timecourses within the DMN system. The DMN system was represented in seven subnetworks, INs 13-19. See Supporting Information Table S1 (de Lacy & Calhoun, 2019) for further description of each subnetwork. The dwell time within each state was computed for each subject. Significant FNC differences between all combinations of DMN subnetworks, and significant differences in dwell time in ADHD > TD, were examined with two-sample t tests at a significant level of α < 0.05, corrected for FDR.

