
Figure 3.
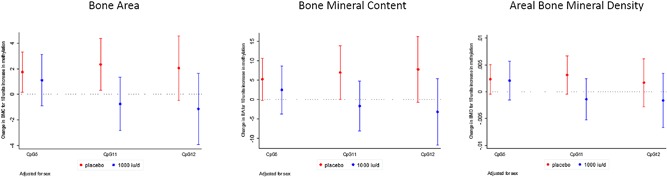
Associations between RXRA methylation at CpG 5, CpG 11, and CpG 12 and whole‐body minus head bone area (cm2), bone mineral content (g), BMD (g/cm2), adjusted for sex, by treatment group (placebo [red bars] or 1000 IU cholecalciferol daily [blue bars]). Outcomes expressed per 10% increase in methylation.