
Fig. 3.
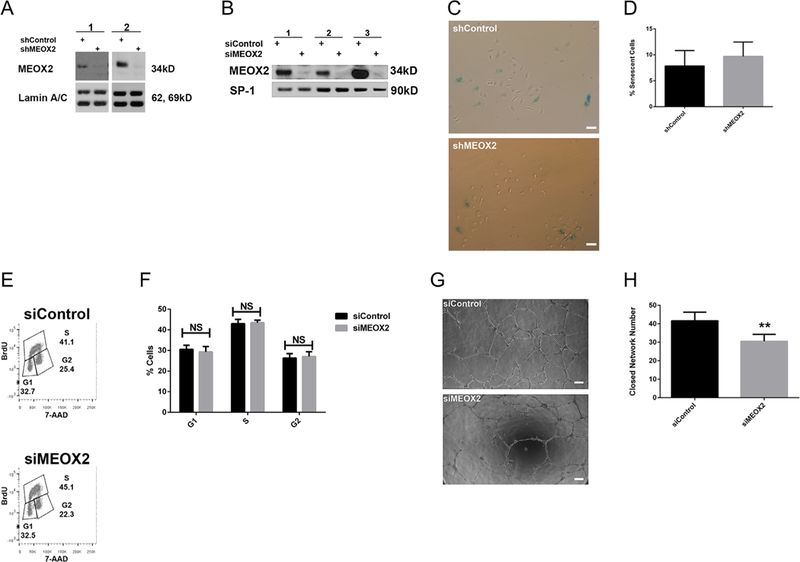
MEOX2 knockdown in ECFCs from DM pregnancies does not alter senescence or cell cycle progression, but decreases network formation. MEOX2 was knocked down in cells from DM pregnancies using shRNA or siRNA techniques. (A) Representative Western blot depicting MEOX2 expression when knocked down by shRNA. Nuclear lysates analyzed for MEOX2. Lamin A/C was used as a loading control. Numbers represent separate transfections of ECFCs from different pregnancies. (B) Representative Western blot showing MEOX2 expression when knocked down by siRNA. Nuclear lysates analyzed for MEOX2. SP-1 was used as a loading control. Numbers represent separate transfections of ECFCs from different pregnancies. (C) Representative images from 3-day senescence-associated-β-galactosidase assays with transduced ECFCs (100× magnification). Scale bars represent 100 μm. (D) Quantitation of 3-day senescence-associated-β-galactosidase assays, n = 9 transductions, P > 0.05 by paired t-test. (E) Representative gating strategy to measure cell cycle progression of transfected ECFCs. Cell-cycle analysis was conducted using flow cytometric analysis of BrdU and 7-AAD staining. (F) Quantitation of cell-cycle analysis of transfected ECFCs, n = 9 transfections, P > 0.05 by repeated measures 2-way ANOVA. (G) Representative images from matrigel network formation assay with transfected ECFCs at 8 h post-plating (50× magnification). Scale bar represents 200 μm. (H) Quantitation of matrigel network formation assay with transfected ECFCs at 8h post-plating, n = 12 transfections, **P < 0.01 by paired t-test.