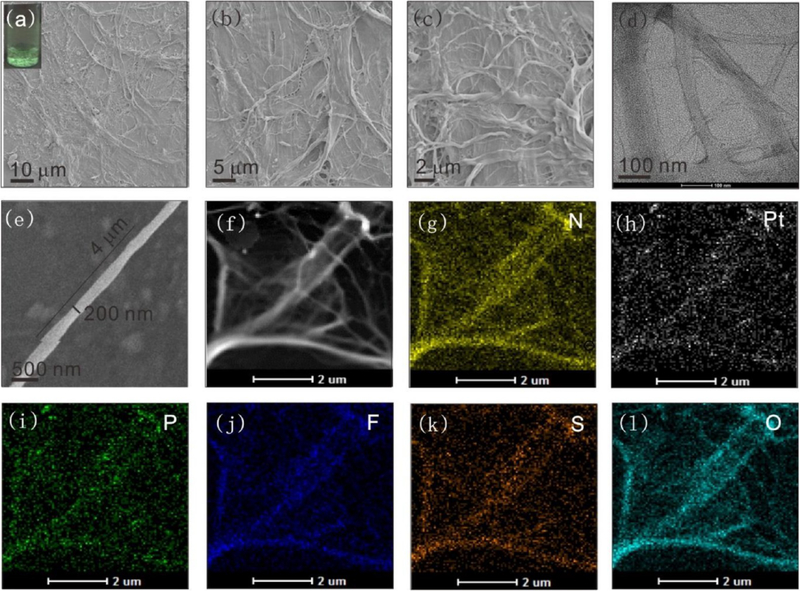
Figure 5.
(a) SEM image of the cage 1-based microfibers (inset: optical image showing the white-green emission of the microfibers in water). (b,c) SEM images of microfibers at different magnifications. (d) TEM image of the microfibers. (e) An enlarged SEM image of a microfiber. (f) A STEM image of the self-assembly of the cage 1-based microfibers. EDX mapping images of the cage 1-based microfibers: the distributions of (g) N, (h) Pt, (i) P, (j) F, (k) S, and (l) O.

