
Figure 3. Systemic Distribution and Mucosal-Homing of Δg NK Cells.
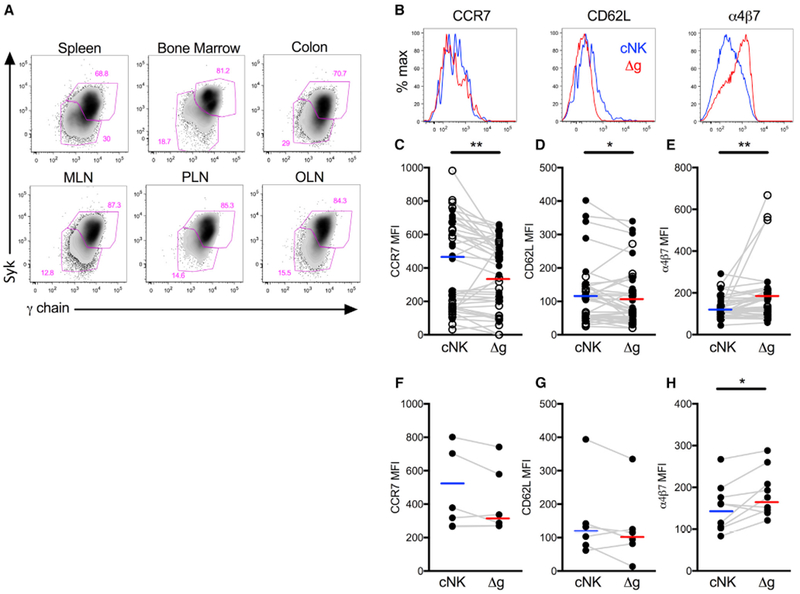
(A) Representative flow cytometry plots showing Δg NK cells in secondary lymphoid and colonic tissues.
(B) Representative histograms showing CCR7, CD62L, and α4β7 expression on Δg and cNK cells in PBMC.
(C–H) Median fluorescence intensities (MFI) of CCR7 (C), CD62L(D), and α4β7 (E) on Δg and cNK cells in PBMC from rhCMV-uninfected (n = 28, open circles) and rhCMV-infected (n = 14, closed circles) rhesus macaques. MFI of CCR7 (F) and CD62L (G) on LN resident NK cells, and α4β7 (H) on colonic NK cells. Horizontal lines indicate medians, and connecting lines are shown between individual animals.
Statistical evaluations were made with Wilcoxon rank-sum test; *p < 0.05; **p < 0.01. MLN, mesenteric lymph node; PLN, peripheral lymph node; OLN, oral lymph nodes.