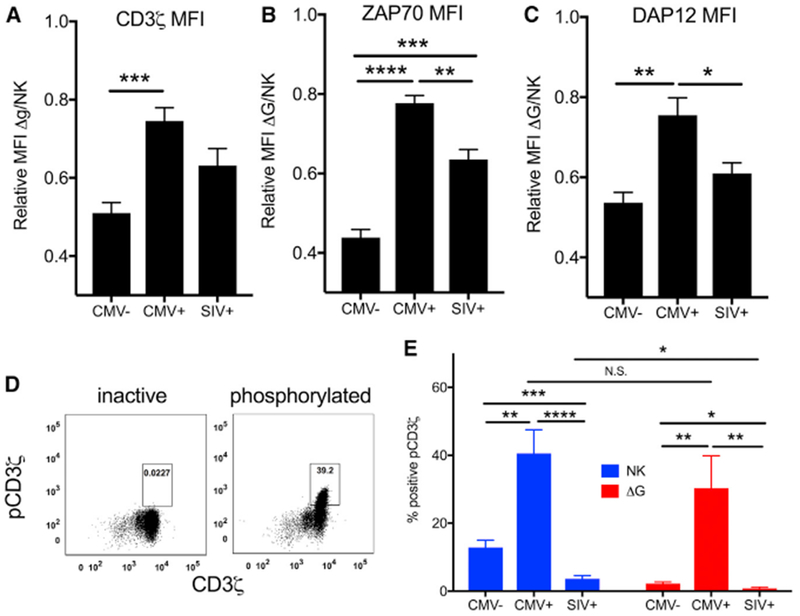
Figure 6. cNK and Δg NK Cell Signaling in rhCMV-Uninfected, rhCMV-Infected, and SIVmac251/SHIV162p3-Infected Rhesus Macaques.

(A–C) Expression of signaling molecules involved in the CD16 signaling pathway were measured by intracellular and phosphor-flow cytometry. Relative expression of parent signaling molecules CD3ζ (A), ZAP70 (B), and DAP12 (C) in Δg NK cells relative to expression in cNK cells.
(D) Representative plots from inactive and activated phosphoCD3ζ samples are shown. Δg and cNK cells were gated as shown in Figure 1.
(E) Frequencies of phosphorylated parent CD3ζ are shown as bars representing means ± SEM of 6–10 animal samples per group.
Statistical comparisons between infection groups were conducted with the Mann-Whitney U test, and statistical comparisons between conditions for individual animals were conducted using Wilcoxon rank-sum test; *p < 0.05; **p < 0.01; ***p <0.001, ****p<0.0001.
