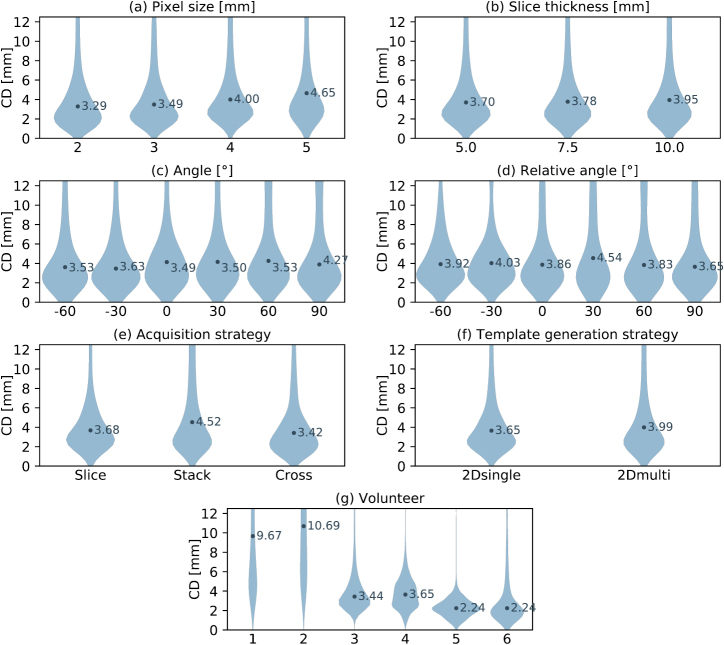
Figure 6.
Violin plots presenting the distribution of centroid distances (CD) between the adapted and ground truth gallbladder contour. (a)–(g) Each plot showcases the dependency of the distribution on a specific imaging parameter. Note that some parameter settings are omitted for the ‘angle’ and ‘relative angle’ plots in order to increase their readability.

