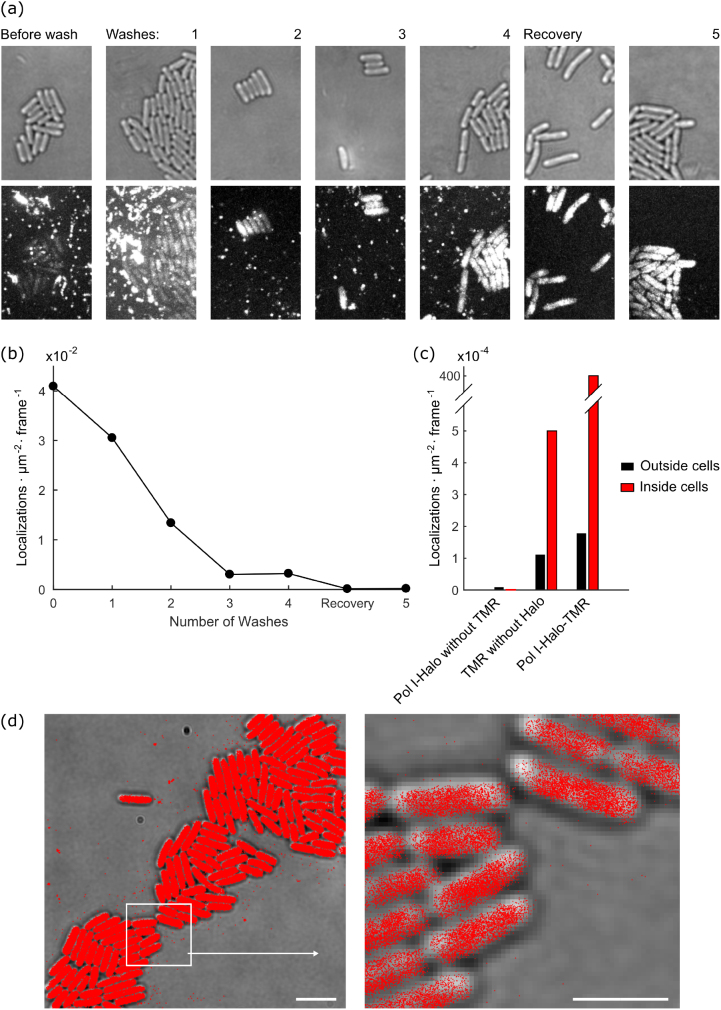
Figure 2.
Removal of fluorescent background after Halo tag labelling. (a) E. coli expressing PolI-Halo-TMR were labelled and a super-resolution movie of 15 000 frames (15.48 ms frame−1) was recorded after each washing step to remove unbound dye. Transmitted light images show cell outlines (top). Fluorescence images show maximum intensity projections from the super-resolution movie (bottom, identical grey scaling across images for all washes). (b) Frequency of background localizations outside cells during the washing procedure. The frequency represents the average number of localizations detected per area per frame. (c) Frequency of localizations outside cells and inside cells: (i) for cells without TMR labelling, (ii) for cells that do not express Halo tag but were labelled with TMR (5 washes), (iii) for cells expressing PolI-Halo that were labelled with TMR (5 washes). (d) Map of PolI-Halo-TMR localizations (5 washes) plotted on transmitted light snapshot (scale bar 4 µm). The boxed area is shown magnified (scale bar 2 µm).

