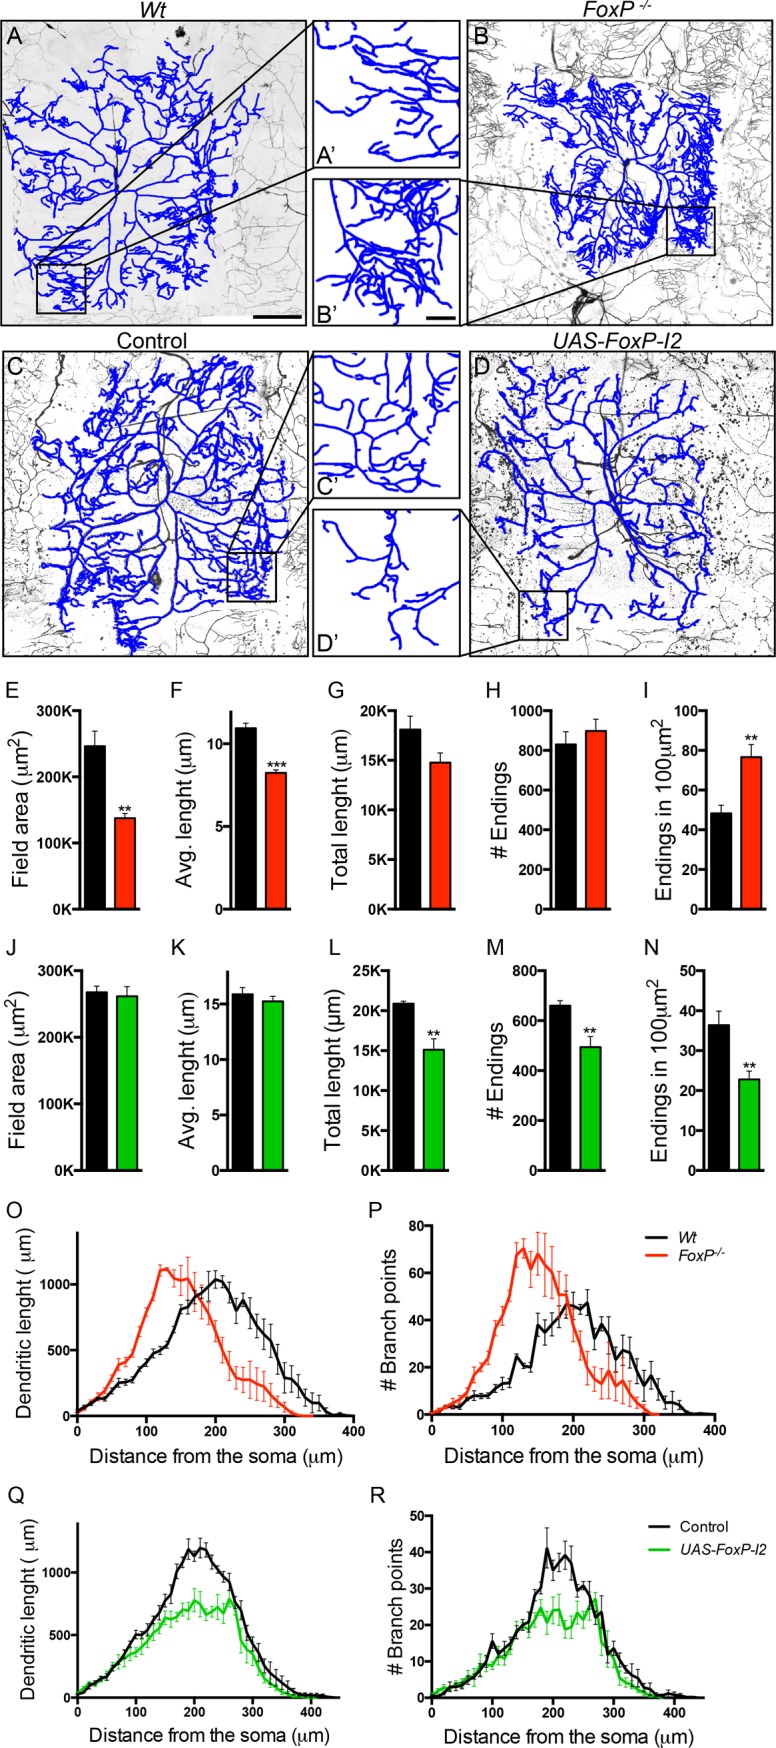
Fig 7. FoxP is required for dendritic growth and negatively regulates branching of type IV da neurons.

(A-D) Confocal projections of class IV da neurons within segment A3 of third instar larvae, visualized with the class IV da-specific GFP expression (477-GAL4>UAS-mCD8::GFP). Reconstructions are represented in blue and are overlapping the original neuron. Scale bar: 100μm. (A’-D’) Magnification of dendrites as highlighted in the original image. Scale bar: 20μm. The following genotypes are depicted in the panels (A) w w/Y; 477-GAL4<UAS-mCD8::GFP/+; +/+ (wildtype), (B) w/Y; 477-GAL4>UAS-mCD8::GFP; FoxP- (FoxP-/-) (C) w/Y; 477-GAL4>UAS-mCD8::GFP/+ (controls) and (D) w/Y; 477-GAL4>UAS-mCD8::GFP/+; UAS-FoxP-I2/+ (UAS-FoxP-I2). (E-N) Quantitative analysis of dendritic trees, FoxP-/- presents a decrease in (E) dendritic field area and (F) average branch length. (G) Cumulative branch length and (H) number of endings are unaffected. Wt (n = 5), FoxP-/- (n = 5). (I) Dendritic endings density (number of endings in 100μm2) is increased in FoxP-/-. Wt (n = 9), FoxP-/- (n = 9). Wt are depicted in black versus FoxP-/- depicted in red. UAS-FoxP-I2 presents unaffected (J) dendritic field area and (K) average branch length. (L) Cumulative branch length and (M) number of endings are decreased. Controls (n = 5), UAS-FoxP-I2 (n = 5). (N) Dendritic endings density (number of endings in 100μm2) is decreased in UAS-FoxP-I2. Controls (n = 10, in grey), UAS-FoxP-I2 (n = 10, in green). (O, Q) Sholl analysis of cumulative dendritic length; graph indicates the sum of dendritic length in concentric circles from the soma situated every 10μm. (O) Wt versus FoxP-/- and (Q) control versus UAS-FoxP-I2. (P, R) Sholl analysis of cumulative number of branching points; graph indicates the sum of branching points located in concentric circles from the soma situated every 10μm. (P) Wt versus FoxP-/- and (R) control (w/Y; 477-GAL4>UAS-mCD8::GFP/+) versus UAS-FoxP-I2. Wt (n = 5), FoxP-/- (n = 5) controls (n = 5) and UAS-FoxP-I2 (n = 5). Data are presented as averages with SEM. T-tests between conditions were performed for each parameter to determine significance (** p<0.01 and *** p<0.001). For the underlying numerical data see S13 and S14 Tables.
