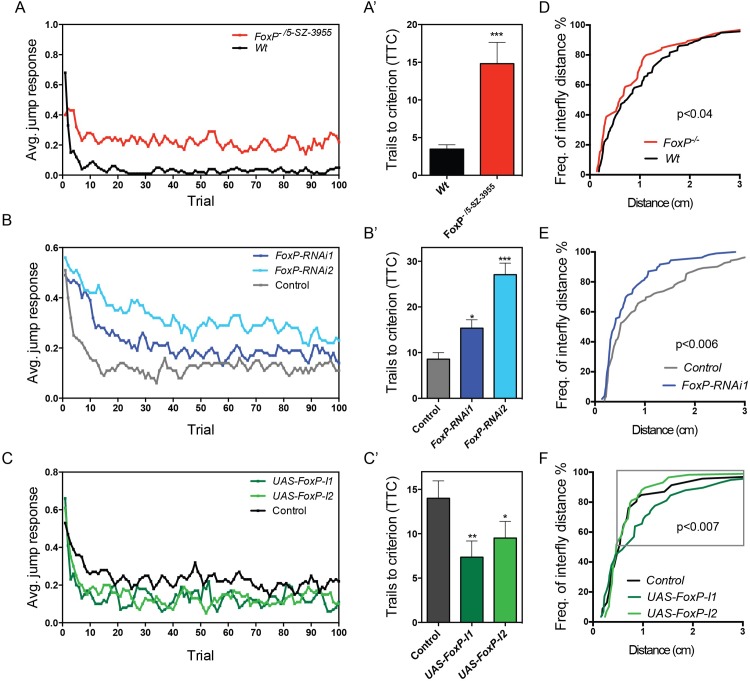
Fig 8. FoxP regulates light-off jump habituation and social distance.
(A-C) Average jump responses (y axis) of three to six days old male flies from 3 independent experiments, with a minimum of 16 flies tested per experiment, plotted over 100 light off trails (x axis). (A) FoxP-/5-SZ-3955 mutant flies (w; 2xGMR-wIR; FoxP-/5-SZ-3955, in red) and wildtype flies (w; 2xGMR-wIR; +/+, in black) (B) FoxP panneuronal knockdown with FoxP-RNAi1 (light blue) and FoxP-RNAi2 (dark blue) (w/Y; 2xGMR-wIR; elav-GAL4, UAS-Dcr2/FoxP-RNAi) and control flies (w/Y; 2xGMR-wIR; elav-GAL4, UAS-Dcr2/+; in grey), (C) panneuronal overexpression of FoxP-I1 (dark green) and FoxP-I2 (light green) (w/Y; 2xGMR-wIR/+; elav-GAL4, UAS-Dcr2/ UAS-FoxP) and the respective controls (w/Y; 2xGMR-wIR/+; elav-GAL4, UAS-Dcr2/+; in black). (A’- C’) Mean number of trials to criterion (TTC) ± SEM of a minimum of 3 experimental replicates. T-tests or one-way ANOVAs with Dunn’s multiple comparisons were performed to assess differences between TTC of the different conditions (* p<0.05, ** p<0.01 and *** p<0.001). For the underlying numerical data see S17 Table. (D-F) Data of the social space assay are represented as cumulative relative frequency of the distance to the closest neighbor (Freq. of interfly distance). (D) FoxP-/- mutants position themselves closer to each other than their Wt controls (Mann-Whitney, n = 136 Wt and n = 86 FoxP-/- flies). (E) Panneuronal FoxP downregulation decreases social space (Mann-Whitney, n = 122 w;UAS-Dcr2/+; elav-GAL4/+ and n = 108 w;UAS-Dcr2/+; elav-GAL4/UAS-FoxP-RNAi1 flies). (F) Panneuronal overexpression of FoxP-I1, but not Fox-I2, increases social space at a distance >0.5 cm away from each other (grey rectangle). (Mann-Whitney, w;;elav-GAL4/UAS-FoxP-I1 and w;;elav-GAL4/UAS-FoxP-I2 n = 58 flies each, and w;;elav-GAL4/+ n = 45 flies).

