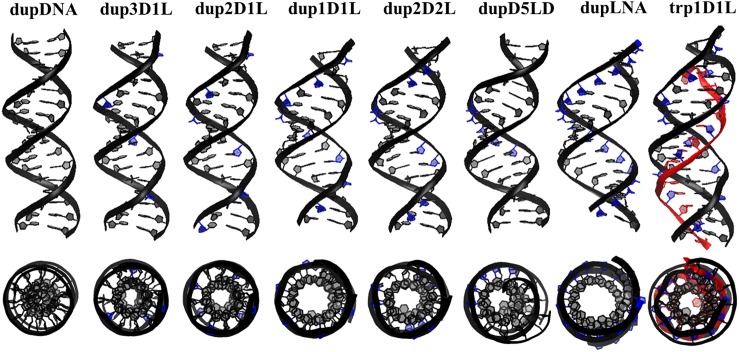
Fig 2. Average structures of the seven simulated duplexes.
For comparison the average structure of the triplex trp1D1L is also shown. Duplex strands are in black with LNA sugars in blue, and the TFO is in red. All the structures are aligned on the same plane. ON sequences for both the duplex and triplex structures are presented in Table 1.

