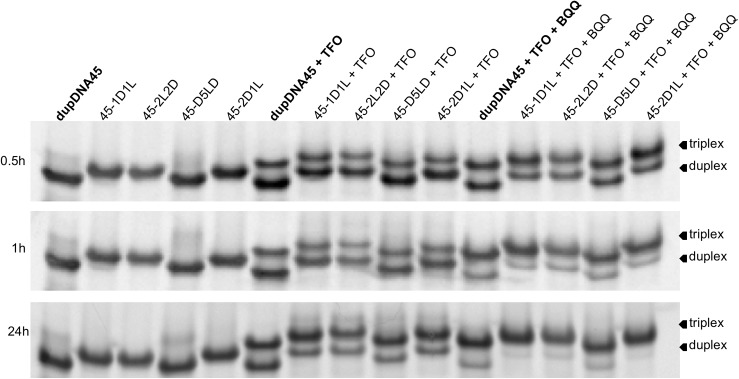
Fig 4. Representative EMSA gel images of TFO binding to the different duplexes.
The TFO to duplex target ratio shown is 2:1 in the absence or presence of BQQ (100:1 molar ratio compared to the duplex) at 0.5, 1, and 24 h. The lower mobility band (top band) corresponds to the triplex whereas the higher mobility band (lower band) corresponds to the duplex structure. The homo duplex is named dupDNA45 while hetero duplexes are named after the polypyrimidine strand.

