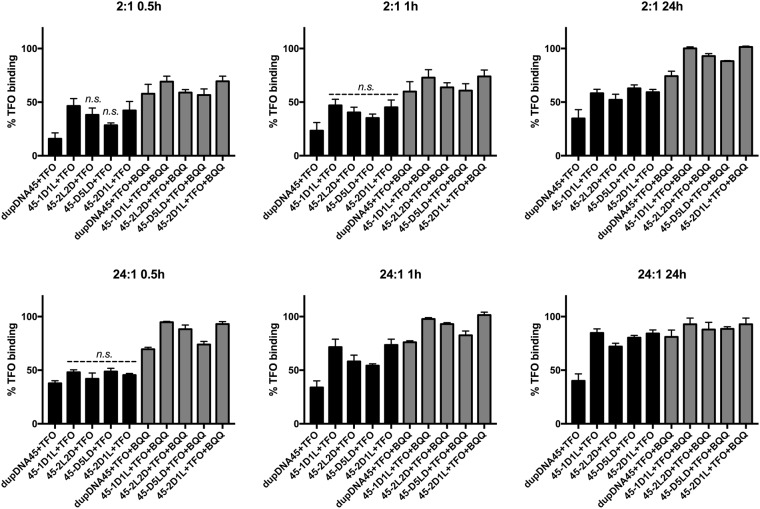
Fig 5. Densitometry quantitation of the EMSA bands.
Graphs shows the percentage of TFO binding at 0.5, 1 and 24 h respectively at the two ratios studied (2:1 and 24:1 TFO:duplex). For duplex sequences refer to Fig 4. Non-significant differences compared to the homo duplex dupDNA45 + TFO are marked with n.s. All other values are significantly higher compared to dupDNA45 +TFO (p = 0.05). Statistical analysis was performed using GraphPad prism (v6) and one-way ANOVA to determine significance. Error bars show the mean+SEM, n = 4 for all samples and time points, except for the 45-D5LD samples where n = 3.

