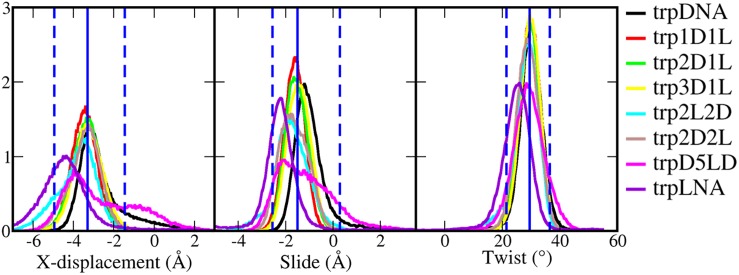
Fig 7. Base pair geometries (x-displacement, slide and twist) for selected triplex structures.
The histograms were sampled from 500 ns simulations. The blue vertical lines show the statistical data from trpDNA, trp1D1L, trp2D1L, trp3D1L, trp2D2L and trp2L2D, where the solid line is the average value and dashed lines indicate the range covering the conformation of 95% snapshots.

