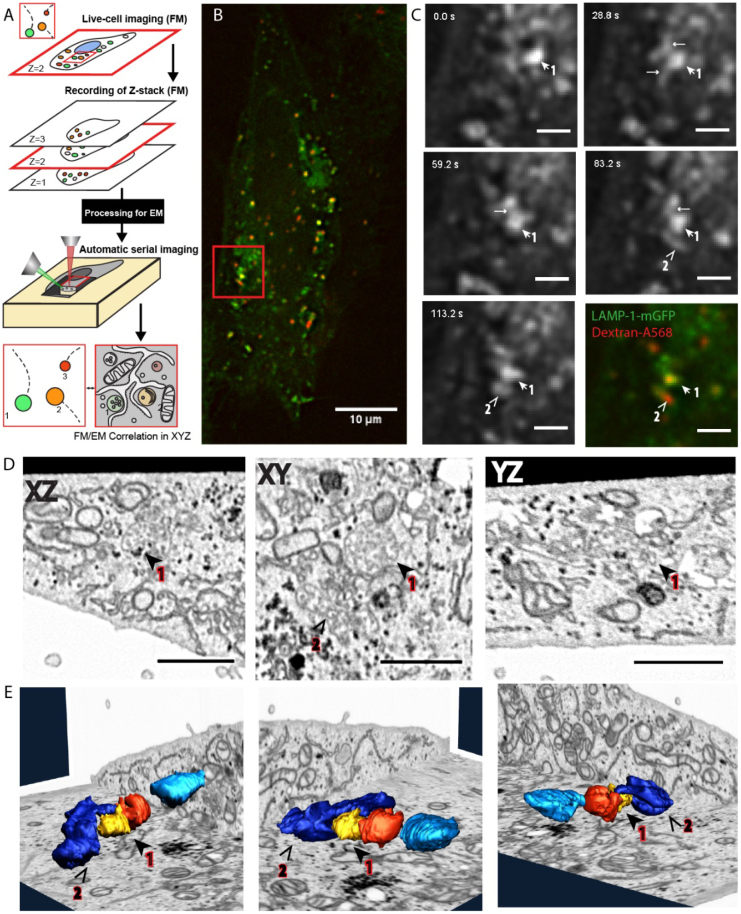
Figure 11.
Volume-CLEM providing a direct link between live cell dynamics and 3D ultrastructure on the single organelle level [82]. (A) Schematic representation of the complete live-cell fluorescence to volume-EM workflow. (B) As an example, a fluorescence image of a LAMP-1-GFP transfected cell, incubated with Dextran-Alexa568 as an endocytic marker. (C) The cell was imaged live for several minutes, followed by in situ fixation. Stills show the LAMP-1-GFP spots (spot 1, 2) during 142 s of imaging. After fixation the cell is stained, embedded in resin, and imaged in FIB-SEM. (D) Shows the slices on all three viewing axes (XZ/XY/YZ) of the reconstructed FIB-SEM dataset containing the live-cell ROI ((B), (C) red square). Both spots 1 and 2 are classified as late endosomes based on their high number of intraluminal vesicles. (E) FIB-SEM segmentation and 3D reconstructions of spots 1 and 2; the organelles imaged in live-cell fluorescence microscopy (1,2) were segmented and correlated with reference LM data.

