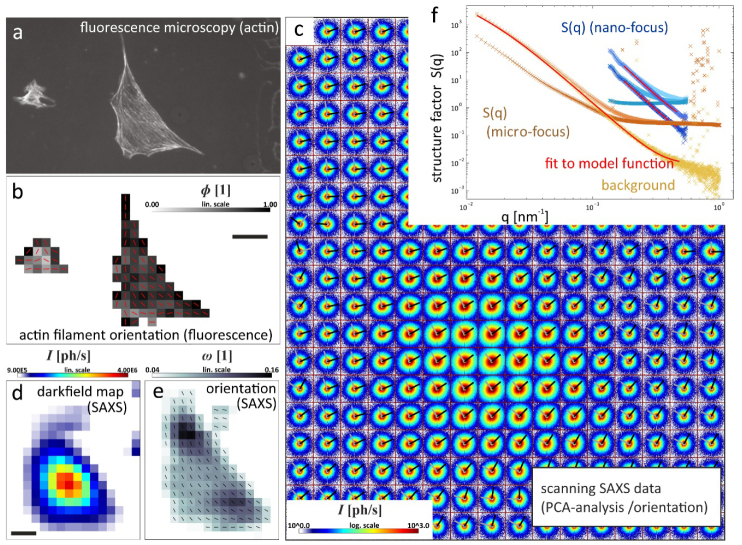
Figure 24.
Scanning x-ray microscopy using a micro- or nano-focused beam. (a) Fluorescence microscopy shows the actin fiber distribution that is pixelwise analysed in (b). (c) Composite image of the scan area including the two rescaled eigenvectors (gray and black) from PCA. (d) Total SAXS signal provides an x-ray darkfield map and (e) anisotropy from PCA for each pixel. (f) Radial intensity profiles can be fitted to get more information in terms of form and structure factors. Reproduced from [163]. © 2017 IOP Publishing Ltd and Deutsche Physikalische Gesellschaft. CC BY 3.0.

