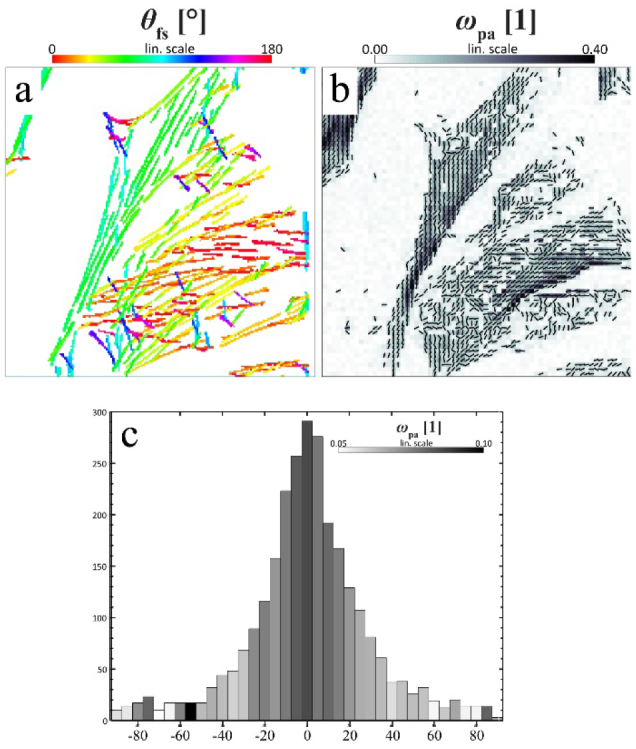
Figure 25.

Correlating fluorescence and x-ray scattering anisotropy. (a) Most significant filaments determined by the filament sensor from a fluorescence micrograph of neonatal rat cardiac tissue. (b) PCA-results of a nano-diffraction scan showing the order parameter Ωpa (grey scale) and filament orientation θpa. (c) Histogram of the angular deviation between both methods revealing excellent correlation. Reproduced from [163]. © 2017 IOP Publishing Ltd and Deutsche Physikalische Gesellschaft. CC BY 3.0.
