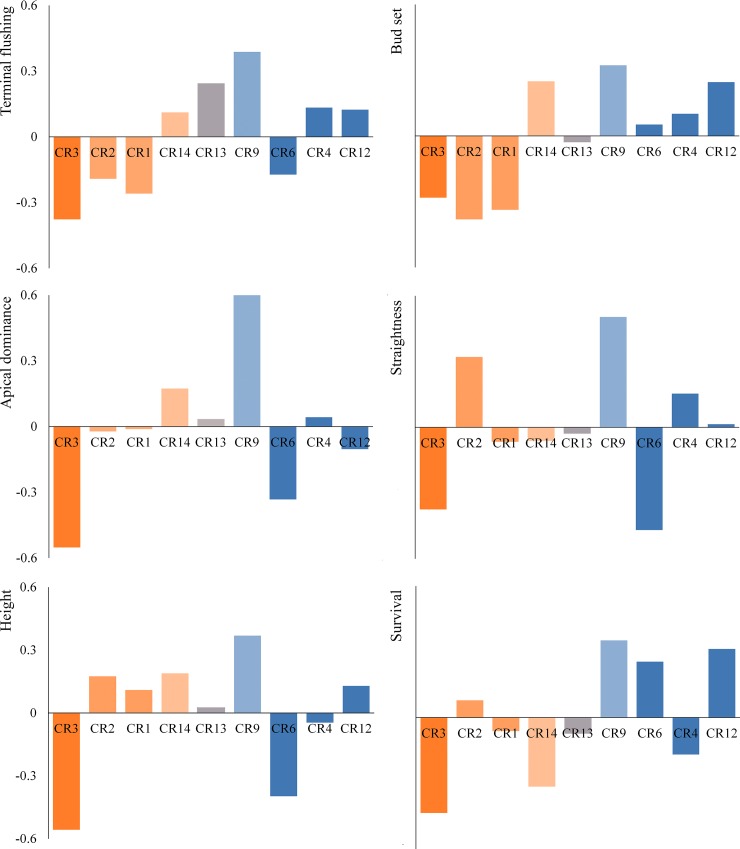
Fig 3. Standardized best linear unbiased predictors of the populations for the traits measured in 2008 that showed a significant population variance in the annual growth rhythm experiment.
For each trait, positive values were standardized with respect to the sum of the positive values, and the same process was repeated with the negative values. Populations were sorted according to their membership coefficients for the Mediterranean cluster. Blue and orange color gradients represent the membership proportions of Northern Iberian Peninsula gene pool and Mediterranean gene pool, respectively. The most intense colors represent the highest ancestry values for each cluster. CR13 is represented by a mixture of the lightest colors representing both gene pools.

