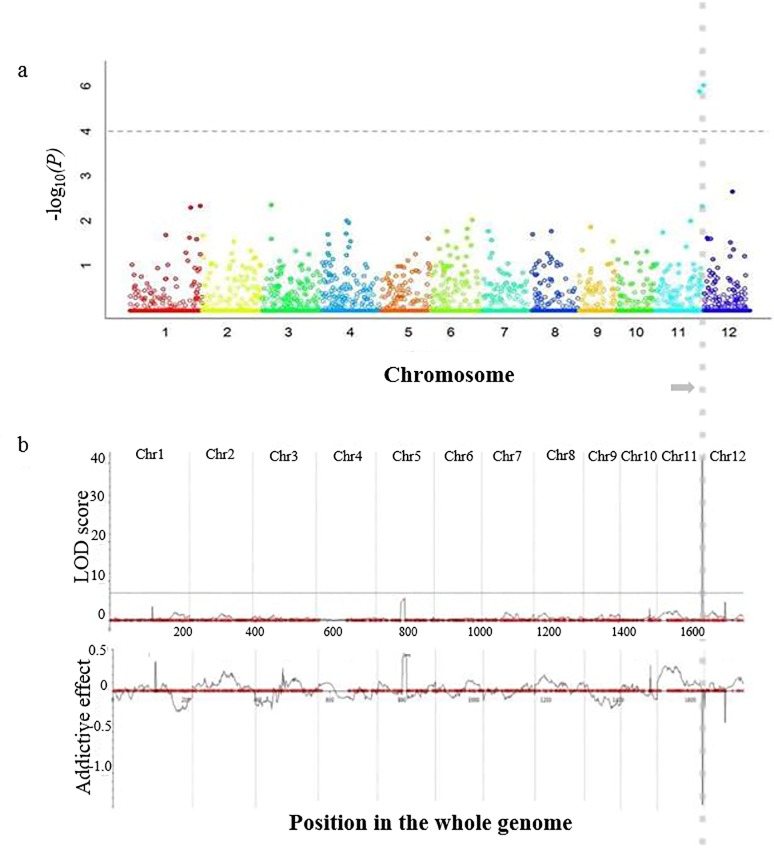
Fig 2. R-gene mapping by association and QTL analysis.
a is Manhattan plot produced by GWAS analysis with genome association and prediction integrated tool (GAPIT). The x-axis indicates genomic position of each SNP and the y-axis is negative logarithm of p-value, obtained from GWAS model. Large peaks on chromosome 11 suggest that the surrounding genomic region has a strong association with the BB race, K3a (p < 0.05) and QTNs marked with grey vertical dotted line. b is LOD profile and additive mapping using inclusive composite interval mapping (ICM) on whole rice chromosome. The SNP location was positioned as red circle on the position in the whole genome. Positive additive effects were derived from susceptible parent Ilpum and negative values were related to the resistant parent. The horizontal grey line is the LOD threshold calculated by 1,000 permutations and the vertical dotted lines indicated by the grey arrow show the loci from both analysis is identical on the chromosome 11.

