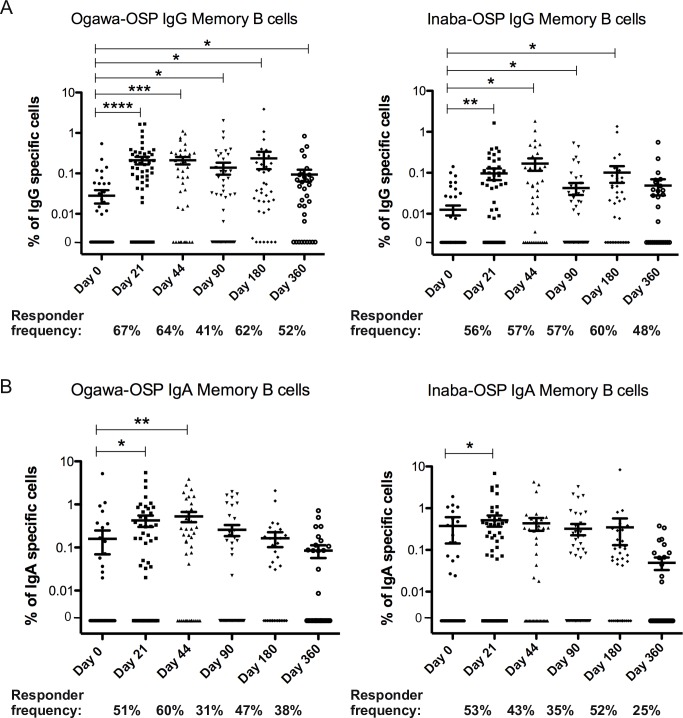
Fig 4. Memory B Cell OSP-specific responses.
Mean antigen-specific IgG (A) and IgA (B) memory B cell responses to Ogawa and Inaba OSP, as percentages of total memory B cells, with error bars representing standard error of the mean. Statistically significant differences relative to baseline (Day 0) are indicated. (* = P<0.05, ** = P<0.01, *** = P<0.001, **** = P<0.0001).

