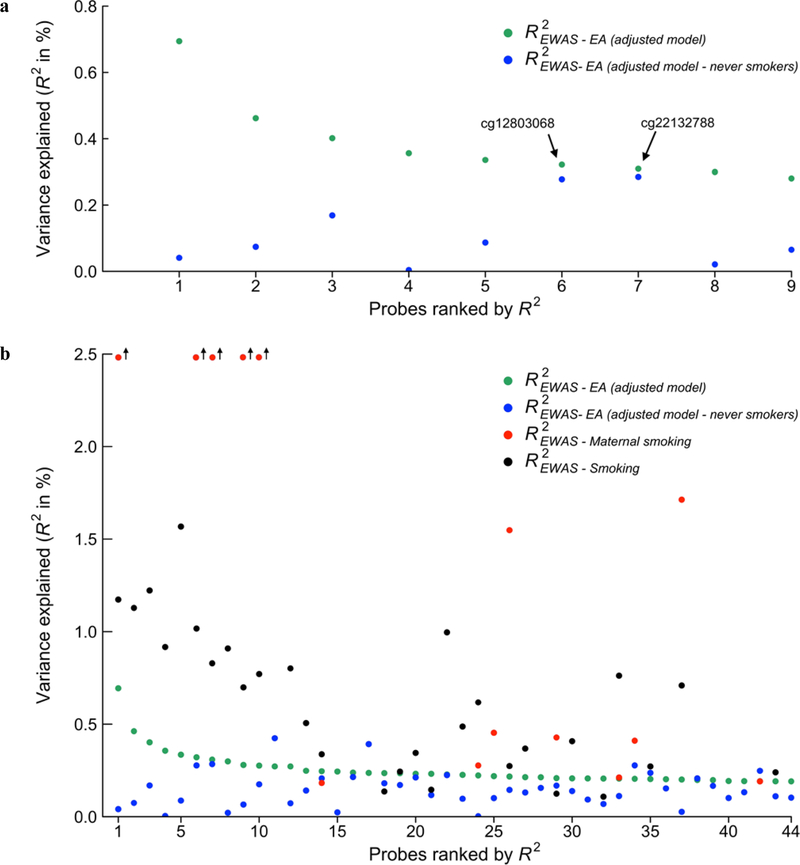
Figure 3 – Comparison of EA EWAS effect sizes with the effect sizes in the never-smoker subsample and in smoking EWAS results.
Panel (a) displays the effect-size estimates in terms of R2 for the 9 lead probes, in descending order, and the lead probe’s corresponding effect size when re-estimated in the subsample of never smokers. Panel (b) displays the same information for the probes of the adjusted model with P < 1×10⁻⁵ (including the 9 lead probes), as well as the same probes’ effect-size estimates from two recent EWAS of smoking (n = 9,389, Joehanes et al., 2016), and maternal smoking (n = 6,685, Joubert et al., 2016). The smoking and maternal smoking estimates are only publicly available for probes associated at FDR < 0.05 in the respective EWAS.

