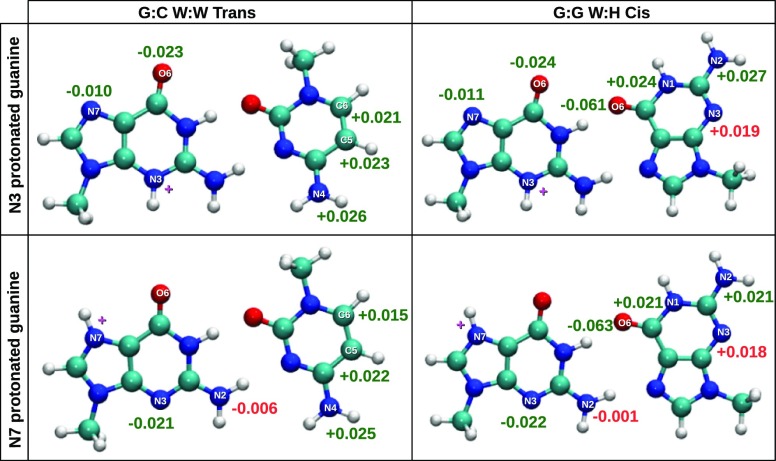
Figure 5.
Change in partial charge distribution (Δq) at the H-bond donor–acceptor sites of the free edges due to base-pairing. Green text is used for sites with improved H-bonding potential and red text is used for sites with reduced H-bonding potential. All values are reported as a fraction of elementary charge.

