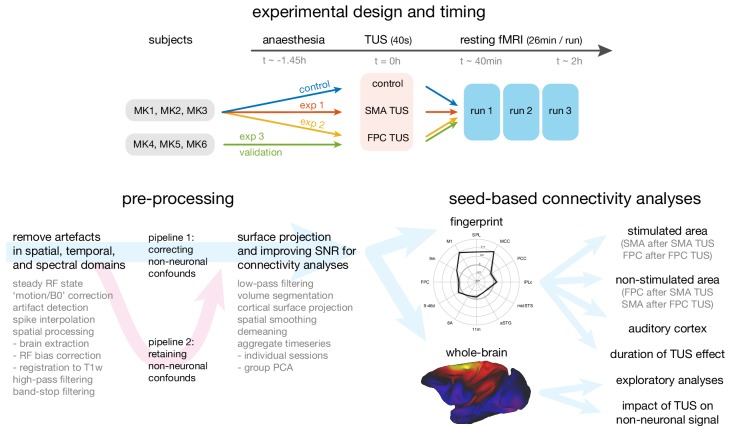
Figure 1. Overview of the experimental design, time-line, pre-processing pipeline, and analysis strategy.
Top panel: The same three macaque monkeys (MK1, MK2, MK3) participated in experiments 1 and 2, and a control experiment conducted in the absence of TUS. Three other monkeys (MK4, MK5, MK6) participated in experiment 3. In all experiments anaesthesia was induced ~1.45 hr before the TUS intervention or no-TUS control. In experiment 1 the 40 s TUS protocol was delivered over the supplementary motor area (SMA), while in experiments 2 and 3, the protocol was targeted at frontal polar cortex (FPC). In all sessions, three consecutive runs of resting fMRI (26 min per run) were acquired starting ~40 min after the TUS or control protocol. Bottom left panel: Data from the resting fMRI runs were pre-processed following a standardized pipeline to address artefacts, improve image quality and signal-to-noise ratio, and prepare for connectivity analyses. By default, non-neuronal confounds were removed from the timeseries, but to allow an analysis of the effect of TUS on non-neuronal signal the data was also processed in parallel in a second pipeline, distinct from the default by omitting the non-neuronal confound regression procedure. Bottom right panel: The effect of TUS on the coupling patterns of the stimulated regions were quantified as ‘connectional fingerprints’ employing pre-defined targets (here illustrated for the SMA in the control state). These fingerprint analyses allowed us to test for the presence and duration of TUS effects in the stimulated areas (SMA after SMA TUS; FPC after FPC TUS), and in control areas, including non-stimulated areas (FPC after SMA TUS; SMA after FPC TUS) and the auditory cortex. Whole brain connectivity maps supported exploratory analyses and an assessment of the impact of TUS on non-neuronal signal (here illustrated for SMA in the control state).

