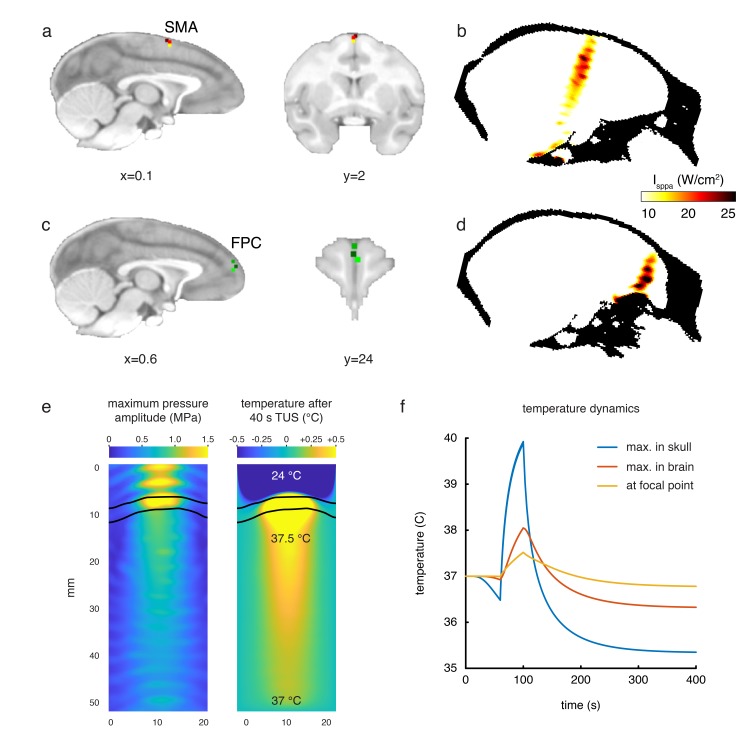
Figure 2. Stimulation targets and thermal modelling.
(a) Stimulation target positions in SMA are shown for each of the three individual animals in three different colours on sagittal and coronal views. (b) Estimates of the focused ultrasound peak intensities and spatial distribution when targeting SMA are derived from numerical simulations using a high-resolution macaque whole-head CT scan, here displayed on a midline sagittal section. (c) FPC targets in three animals are shown on sagittal and coronal sections. (d) Estimated peak intensities and spatial distribution when targeting FPC shown on a sagittal section. (e) Whole-head simulations of the acoustic wave and thermal dynamics provided estimates of the maximum pressure amplitude (left panel) and the temperature after 40 s TUS (right panel). The data depict a cropped plane of the whole-head simulations with the sonic coupling cone at the top and the brain at the bottom; the skull is outlined in black. Pressure and temperature are maximal in the skull, which is more absorbing than soft tissue. (f) Temperature dynamics for the maximum temperature in the skull (blue), maximum temperature in the brain (red) and at the geometrical focal point in the cortex (yellow).

