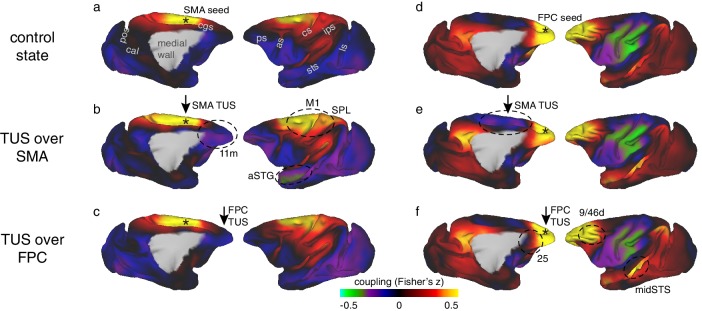
Figure 3. Coupling of activity between stimulated areas and the rest of the brain in experiments 1 (SMA) and 2 (FPC).
The left panels show activity coupling between SMA and the rest of the brain in the control state (a), after SMA TUS (b), and after FPC TUS (c). The right panels show activity coupling between FPC and the rest of the brain in the control state (d), after SMA TUS (e), and after FPC TUS (f). Functional connectivity from TUS-targeted regions is therefore summarized in panels (b) and (f) (i.e. SMA connectivity after SMA TUS and FPC connectivity after FPC TUS). Each type of TUS had a relatively selective effect on the stimulated area: SMA coupling was changed by SMA TUS (b) and FPC coupling was changed by FPC TUS (f). Positive correlations are represented in warm colours from red to yellow, negative correlations are represented in cool colours from blue to green. Key regions of change are highlighted by black dashed ovals. TUS target sites are indicated with arrows. Connectivity seed regions are indicated with black asterisks. Key anatomical features are labelled in panel (a): pos, parieto-occipital sulcus; cal, calcarine sulcus; cgs, cingulate sulcus; ps, principal sulcus; as, arcuate sulcus; cs, central sulcus; ips, intraparietal sulcus; sts, superior temporal sulcus; ls, lunate sulcus.


