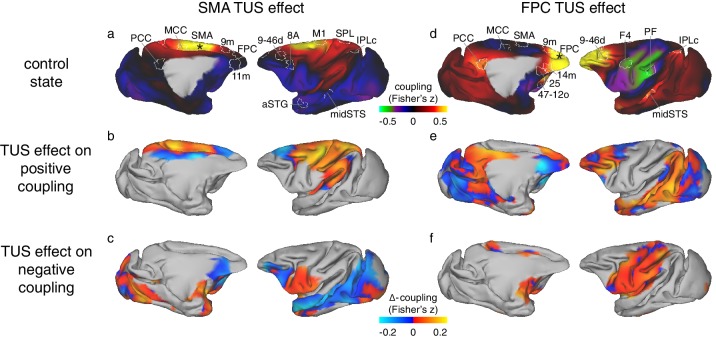
Figure 4. Differential effect of TUS on coupling of activity between stimulated areas and the rest of the brain in experiments 1 (SMA) and 2 (FPC).
The left panels show activity coupling between SMA and the rest of the brain in the control state (a), the differential effect of SMA TUS for areas positively coupled (z > 0.1) with SMA in the control state (b), and for areas negatively coupled (z < −0.1) with SMA in the control state (c). The right panels show activity coupling between FPC and the rest of the brain in the control state (d), the differential effect of FPC TUS for areas positively coupled (z > 0.1) with FPC in the control state (e), and for areas negatively coupled (z < −0.1) with FPC in the control state (f). Panels (a) and (b) are reproduced here from Figure 3 for reference and to illustrate the location and extent of the ROIs used in the fingerprint analyses (Figure 5). Hot colours in (b) and (e) indicate enhanced coupling following TUS compared to the control state, while cool colours indicate reduced coupling. In (c) and (f) hot colours indicate reduced negative coupling, while cool colours indicate further negative coupling. All other conventions as in Figure 3. The TUS induced changes to the coupling of the stimulated regions were not limited to the a-priori defined ROIs but extended across many regions according to the connectional topography of the stimulated region.

