. 2019 Feb 5;8:e40789. doi: 10.7554/eLife.40789

Figure 5. Comparisons of the structural changes induced by mutation W93G.

Representative structures from MD simulations of (A) NDM1-WT (grey) and NDM1-W93G (blue), and (B) VIM2-WT (grey) and VIM2-W93G (green). (C) Changes in hydrophobic interactions between the phenyl ring of the PMH substrate (CE3 and CZ2 atoms) and residue Leu65 and Val73 (α-carbon) of NDM1 upon W93G, during the MD simulations. (D and E) Comparison of the position of Trp93 and second shell residues in the (D) NDM1-WT (PDB-ID: 3SPU) and (E) VIM2-WT (PDB-ID: 1KO3) crystal structures. (F) Average distance between the p-nitrophenyl ring of the PMH substrate and the side chain rings of Phe70 in NDM1, and Tyr73 in VIM2, when the two rings form a π-π interaction during the MD simulations.

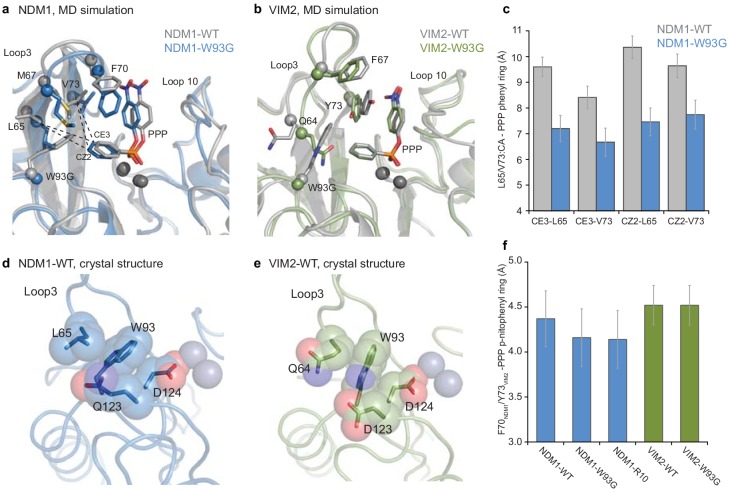
Figure 5.

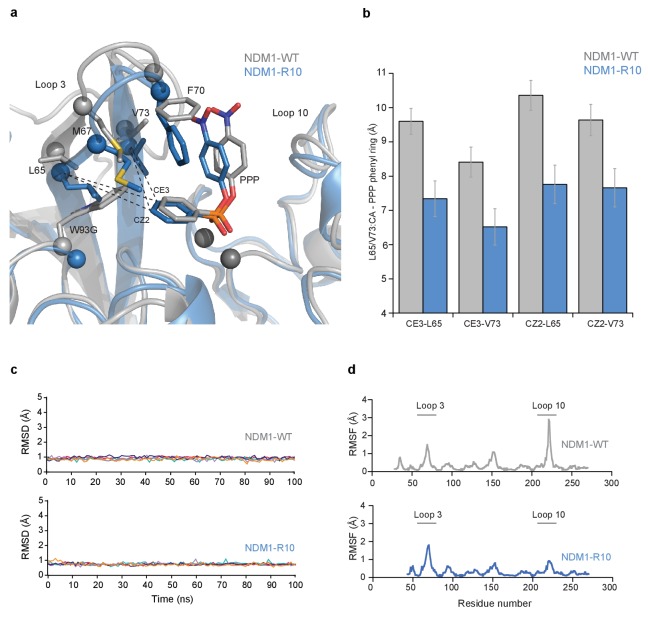
Figure 5—figure supplement 1. The molecular dynamics (MD) simulations of NDM1-WT and NDM1-R10.

Figure 5—figure supplement 1.

(A) Overlay of representative structures from the MD simulations of NDM1-WT (grey) andNDM1-W93G (blue) in complex with the PPP substrate (B) The average distance between the substrate and active site residues Leu65 and Val73 during the MD simulation of NDM1-WT and R10. (C) Root-mean square deviations (RMSD, Å) of all C-α atoms from the MD simulations of the NDM1-WT and NDM1-R10 in complex with PPP. The relevant enzyme variants are indicated on each panel. The data is presented individually for five independent 100 ns trajectories in each system, and for clarity the data was plotted using cspline smoothing function implemented in Gnuplot. (D) Root-mean square fluctuations (RMSF, Å) of C-α atoms calculated from the last 50 ns of all five 100 ns simulations of NDM1-WT and NDM1-R10 in complex with the PPP substrate.
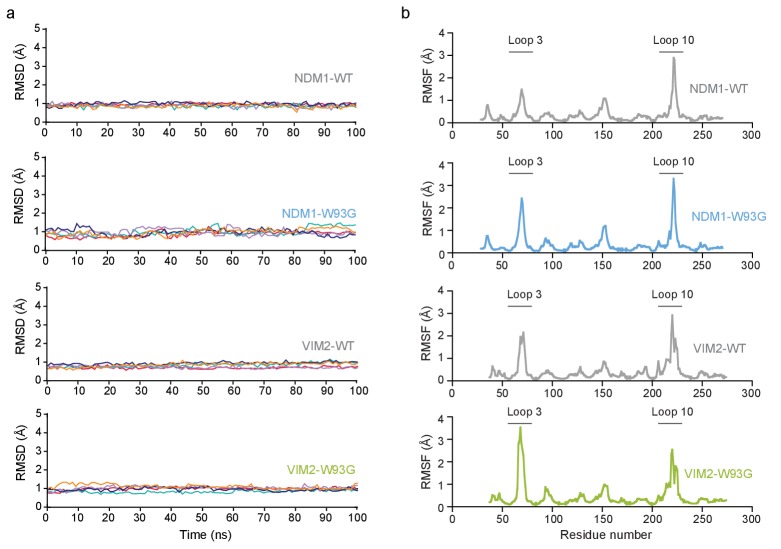
Figure 5—figure supplement 2. The molecular dynamics (MD) simulations of NDM1-WT, NDM1-W93G, VIM2-WT, and VIM2-W93G.

Figure 5—figure supplement 2.

(A) Root-mean square deviations (RMSD, Å) of all the C-α atoms from the MD simulations of NDM1-WT, NDM1-W93, VIM2-W93G in complex with PPP. The relevant enzyme variants are indicated on each panel. The data is presented individually for five independent 100 ns trajectories in each system, and for clarity, the data was plotted using cspline smoothing function implemented in Gnuplot. (B) Root-mean square fluctuations (RMSF, Å) of C-α atoms during the MD simulations. The data was calculated from the last 50 ns of all five 100 ns simulations of each of the four enzyme-PPP complexes (specific variant indicated in each panel).