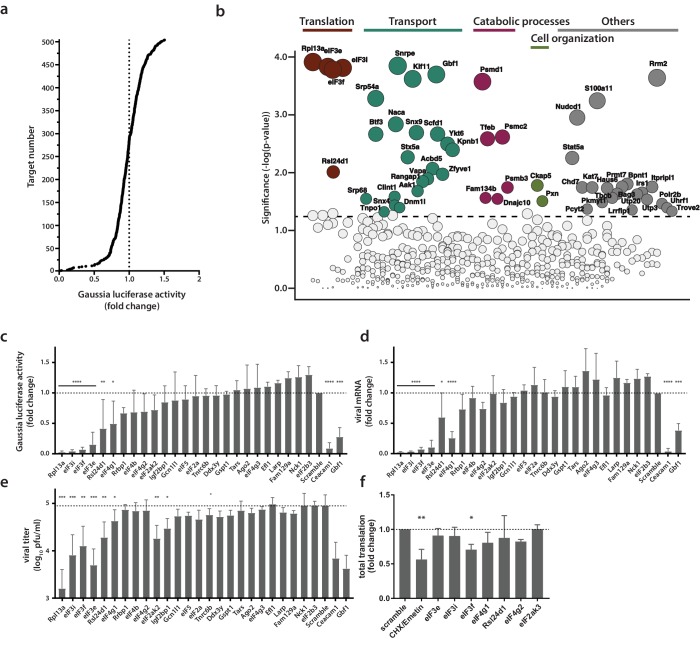
Figure 4. Identification of proviral factors within the coronavirus RTC microenvironment.
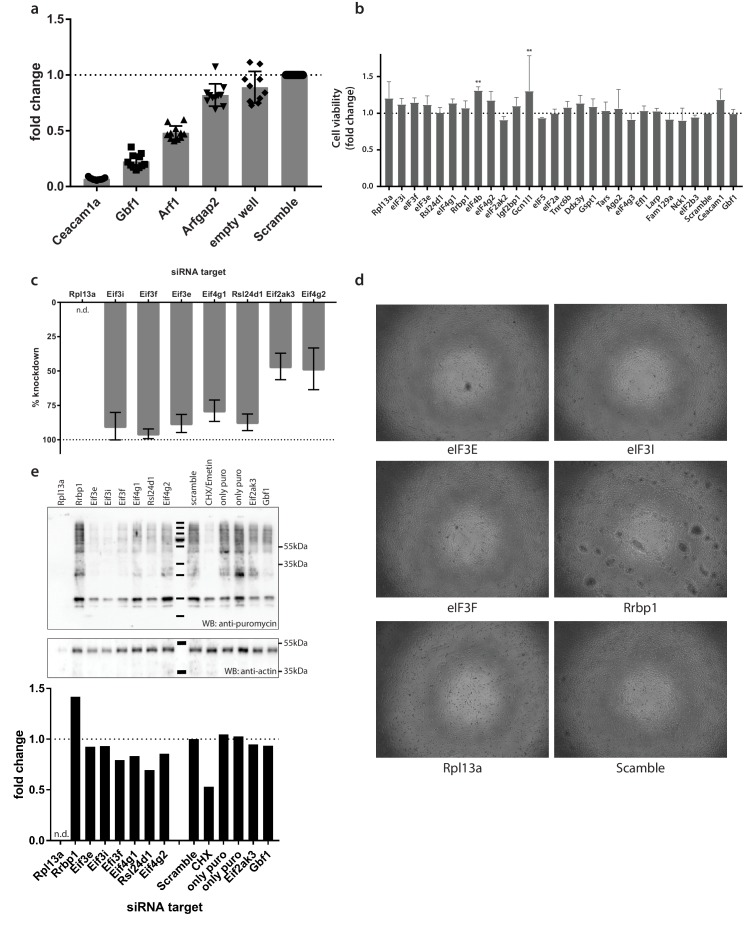
(a) Impact of siRNA-silencing of RTC-proximal cellular proteins on viral replication. L929 fibroblasts were reverse-transfected with siRNAs (10 nM) for 48 hr before being infected with MHV-Gluc (MOI = 0.05, n = 4). Replication was assessed by virus-mediated Gaussia luciferase expression at 15 h.p.i. and was normalized to levels of viral replication in cells targeted by scrambled siRNA controls. Target proteins to the left of the dashed line represent RTC-proximal factors whose silencing decreased viral replication. (b) Bubble plot illustrating host proteins that significantly impact MHV replication. Bubble size is proportional to the level of viral replication impairment. Colors correspond to the functional categories highlighted in Figure 3. Light grey bubbles (below the dashed line) represent host proteins that did not significantly impact MHV replication (p-value > 0.05). (c, d, e, f) Silencing of RTC-proximal components of the cellular translation machinery. Upon 48 hr siRNA silencing of factors assigned to the category ‘translation’ (Figure 3), L929 fibroblasts were infected with MHV-Gluc (MOI = 0.05, n = 3). Luciferase activity (c), cell-associated viral RNA levels (d) and viral titers (e) were assessed at 12 h.p.i.. (f) Western blot quantification of total cellular translation following silencing of a subset of the host translation apparatus. Upon 48 hr siRNA-silencing, L929 fibroblasts were pulsed with 3 µM puromycin for 60 min. Control cells were treated, prior to puromycin incubation, with 355 µM cycloheximide and 208 µM Emetin for 30 min to block protein synthesis. Cell lysates were separated by SDS-PAGE and Western blots were probed using anti-puromycin antibodies to assess puromycin incorporation into polypeptides and normalized to actin levels. Error bars represent the mean ± standard deviation, where * is p ≤ 0.05, ** is p ≤ 0.005, *** is p ≤ 0.0005 and **** is p < 0.0001.


