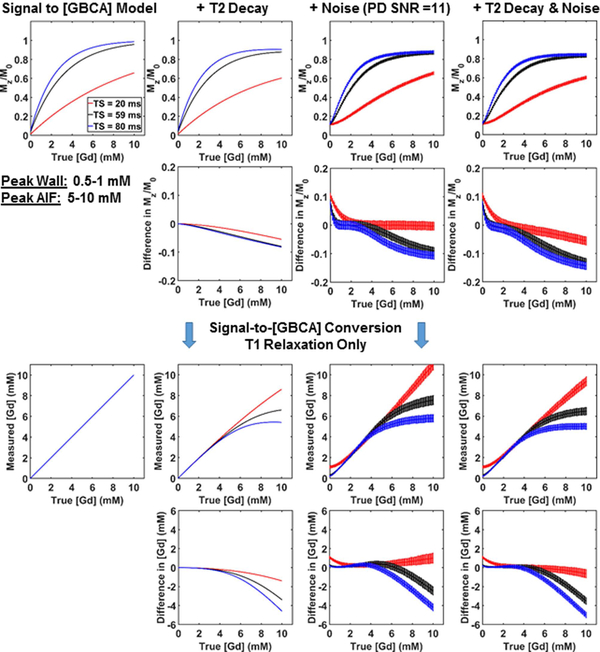
Figure 3:
Numerical phantom results with concentration values ranging from 0 to 10 mM. (Row 1) Plots of normalized signal as a function of ground truth [GBCA]: T1 relaxation only (column 1), T2 decay added condition (column 2), noise added condition (column 3), and T2 decay and noise added condition (column 4). (Row 2) The corresponding errors in normalized signal. (Row 3) The corresponding plots of measured [GBCA] as a function of ground truth [GBCA]. Each curve was derived from our signal modeling that only accounts for T1 relaxation. (Row 4) The corresponding erros in [GBCA]. Errors induced by noise and T2 decay in normalized signal and measured [GBCA] are smaller for higher TS values (59 and 80 ms) than TS = 20 ms at low concentration values between 0.5 to 1 mM representing peak enhancement in the myocardium, whereas errors in normalized signal and measured [GBCA] are smaller for TS = 20 ms than higher TS values (59 and 80 ms) at high concentration values between 5 to 10 mM representing peak blood enhancement in the left ventricular cavity (i.e. AIF).

