Figure 5:
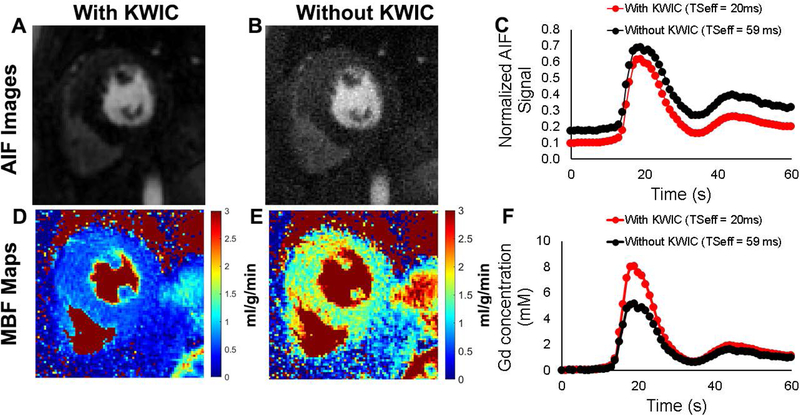
Representative arterial input function (AIF) images reconstructed with (A) and without (B) KWIC filtering. (C) The corresponding normalized signal-time curves with (red) and without the KWIC filtering (black). The corresponding MBF maps with (D) and without KWIC filtering (E). (F) The corresponding AIF curves with (red) and without the KWIC filtering (black).

